Why it matters
Today's manual process, and the same job with the app
Inventory planners at a retailer, who own the lead times, safety stock and service targets set in the planning system.
✕Today's manual process
1Pull up each setting's history in the planning system, one lead time or safety stock at a time.
2Work out the gap in a spreadsheet: the average, the trend, and how far it sits from the number on file.
3Decide if it matters, whenever someone remembers to check.
4One stale setting means stock ordered at the wrong time: empty shelves, or too much in the back room.
Rechecked only when someone remembers
✓With the app
1Each setting is read with its last ten periods of actual readings beside it.
2The arithmetic is done for you: the average, the trend and any one-off spikes.
3Settings that drifted are flagged, each with a suggested new value worked out from the readings.
4A planner decides on each flag; nothing in the planning system changes on its own.
Planners review only the flagged settings
See it work
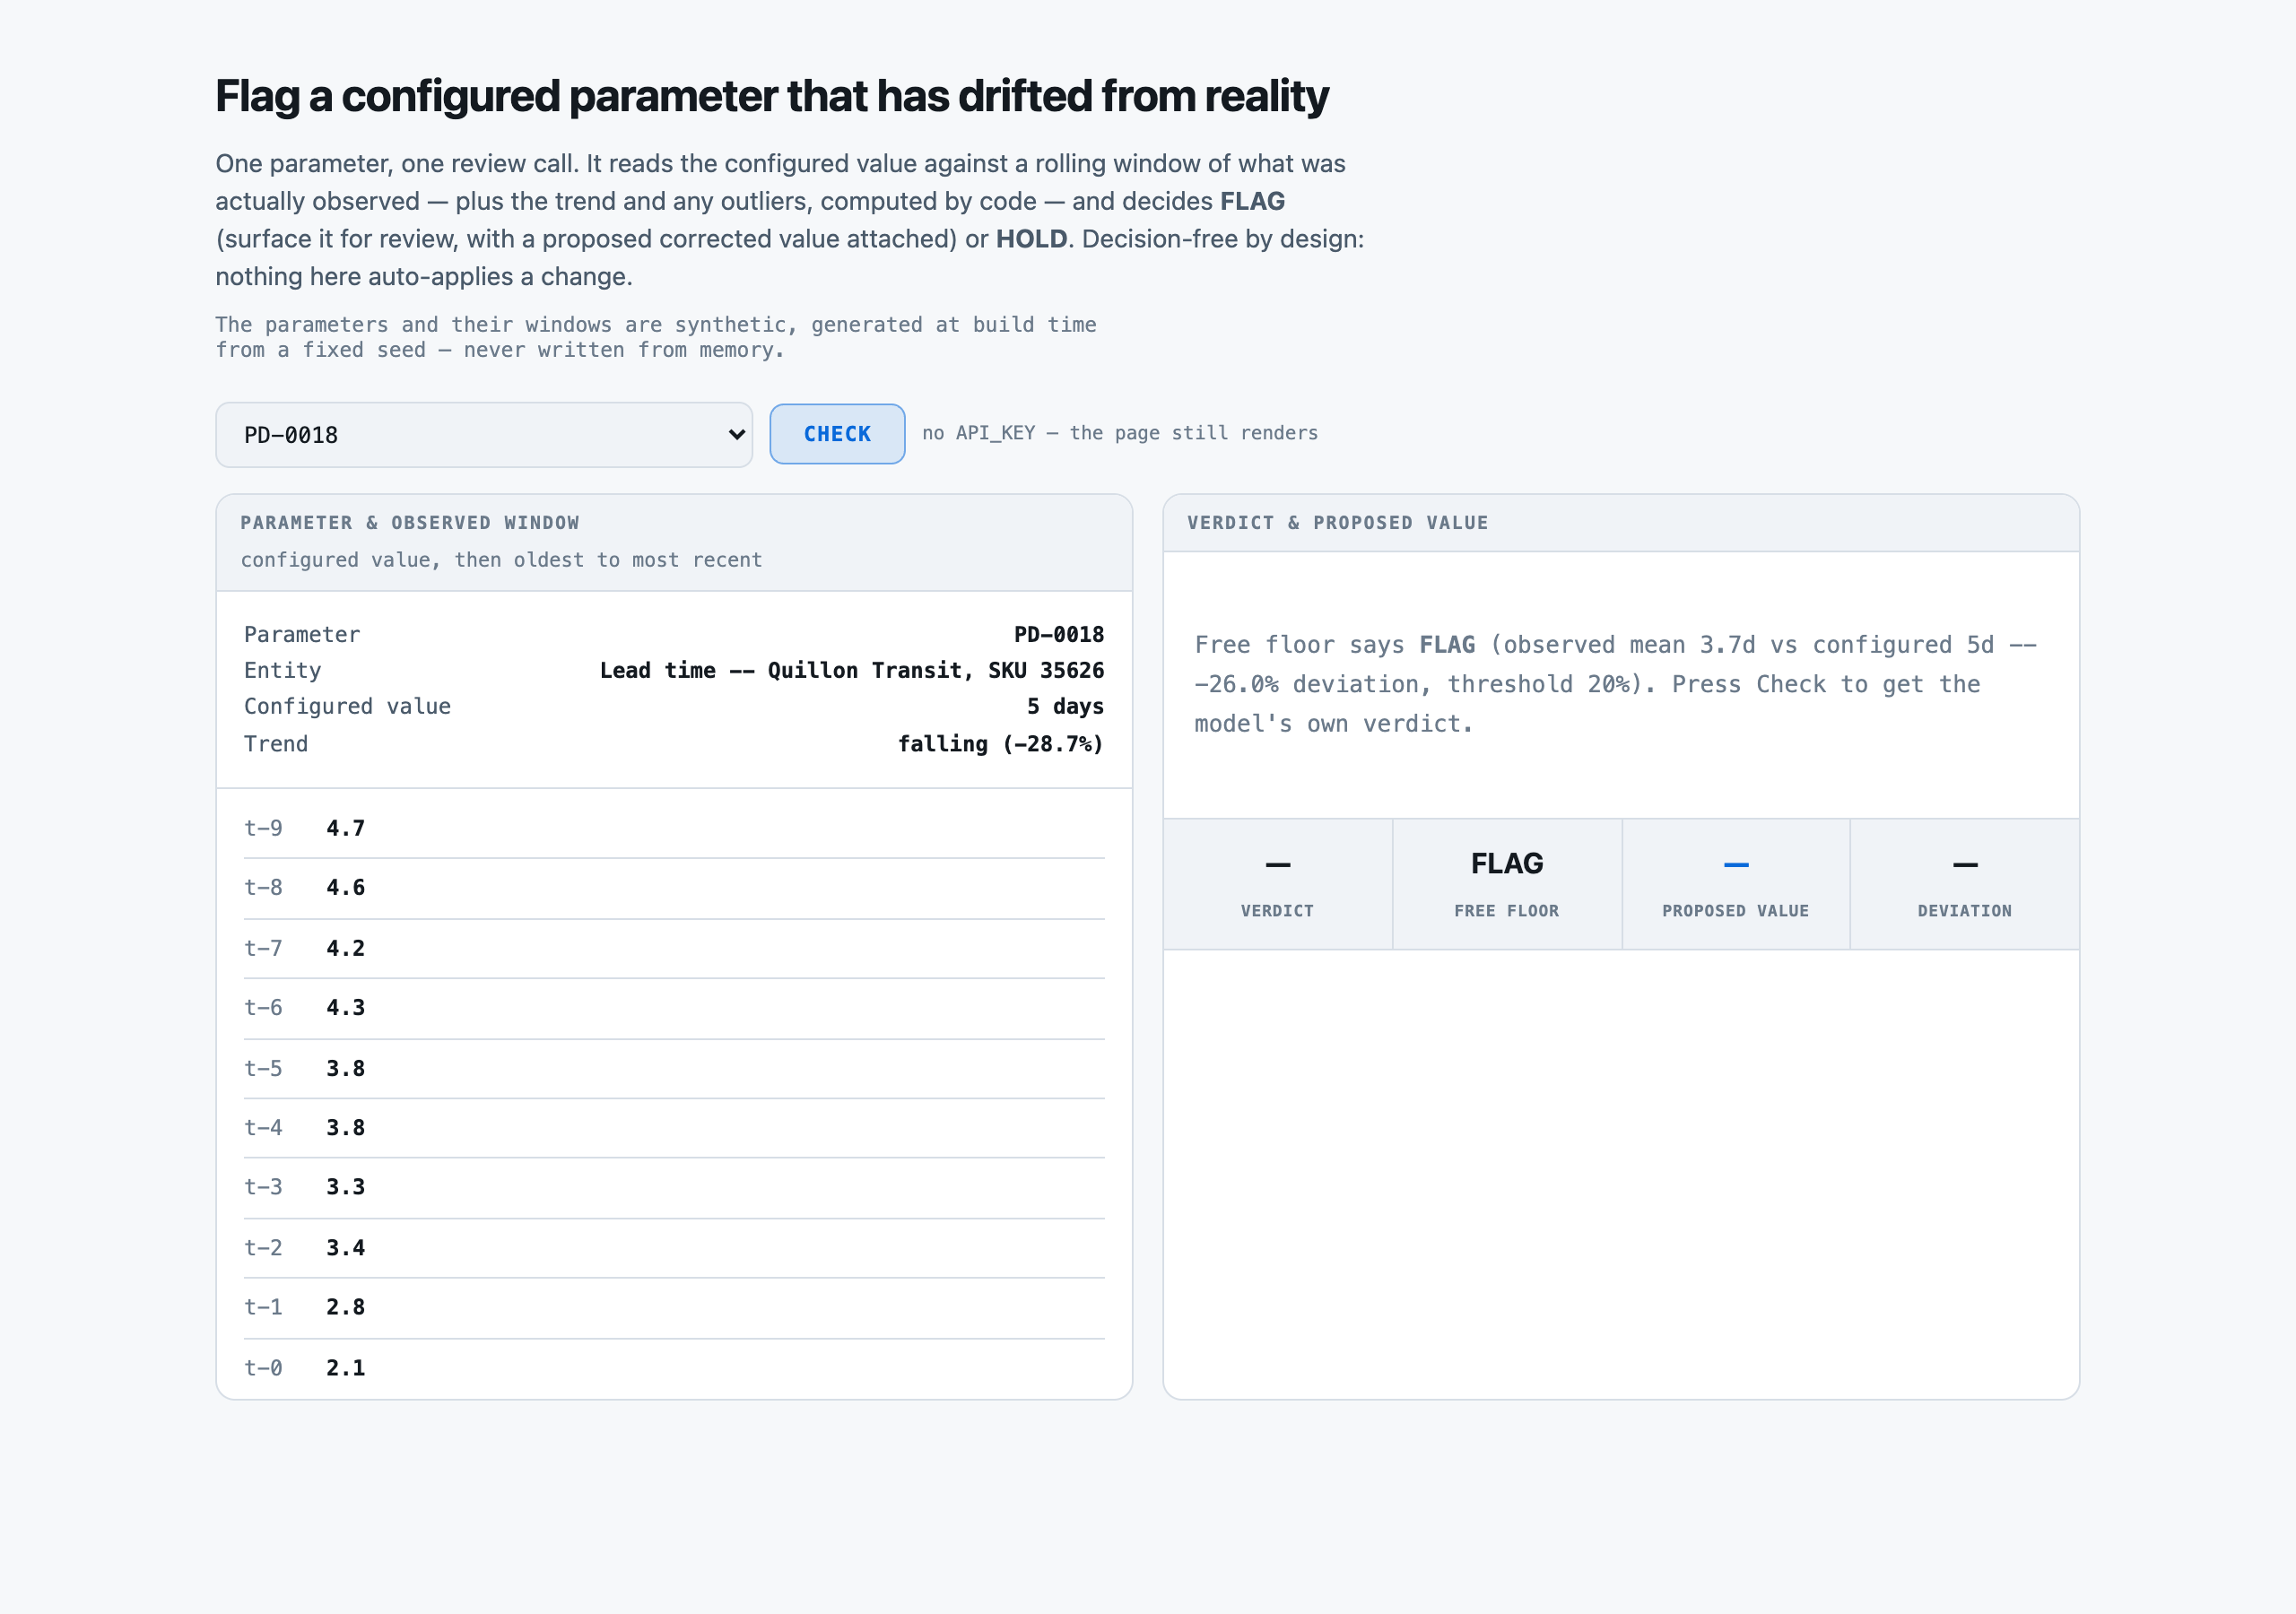
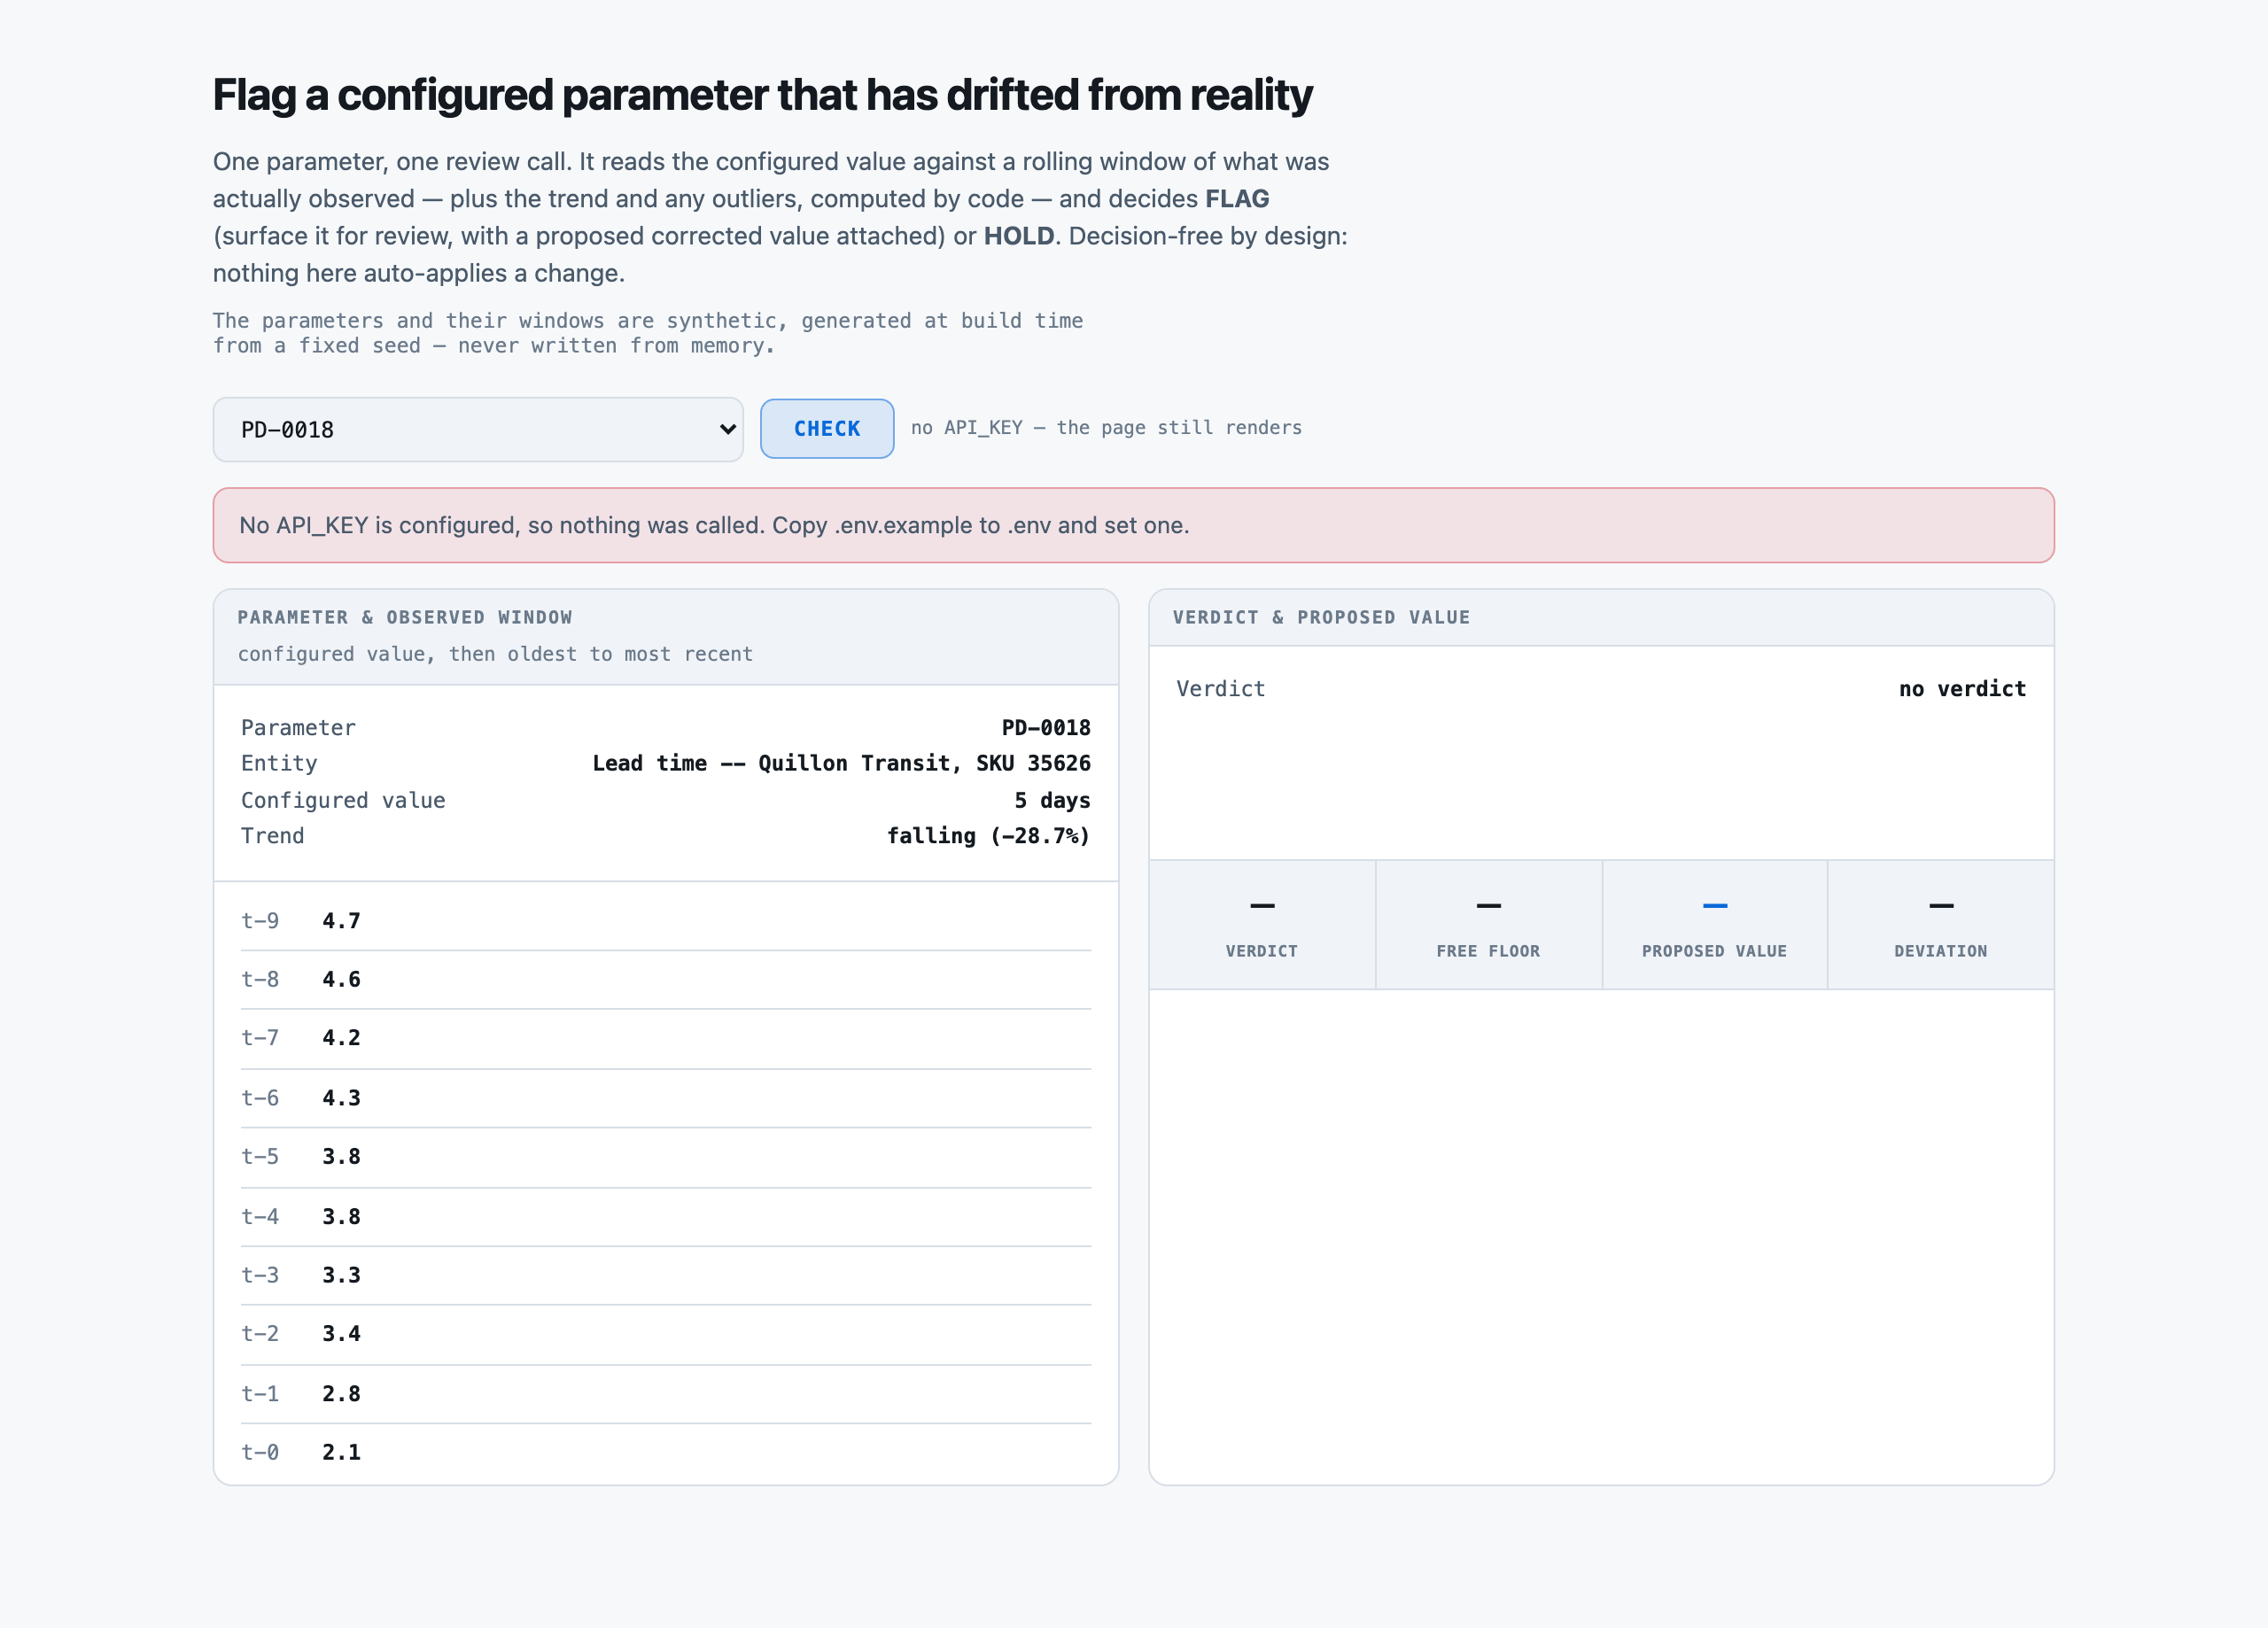
One real case, read by the app, step by step
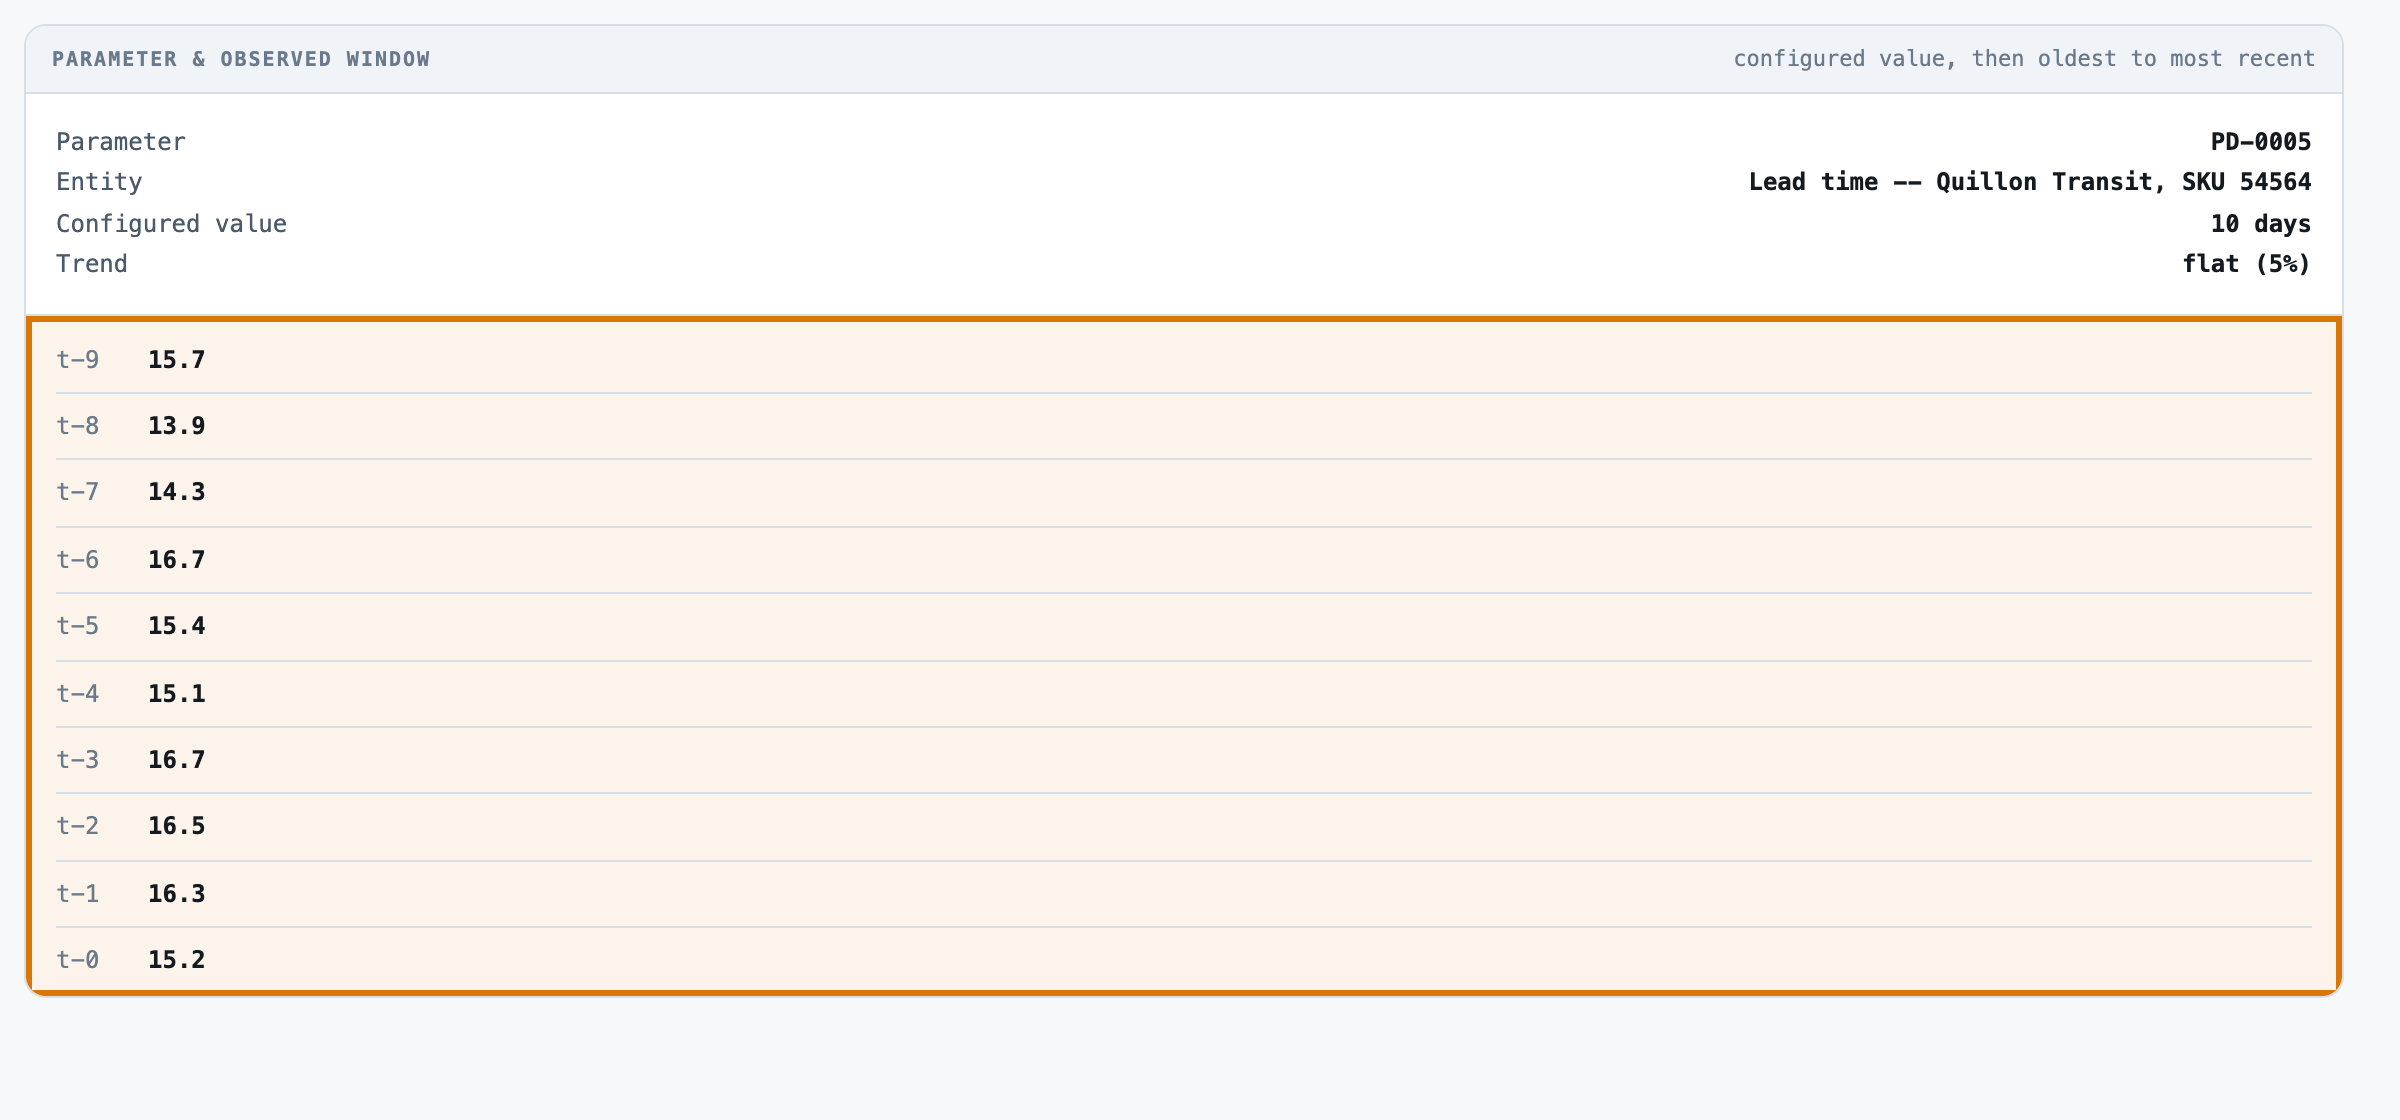
Quillon Transit's lead time for SKU 54564 is set at 10 days, but its last ten periods ran from 13.9 to 16.7 days.
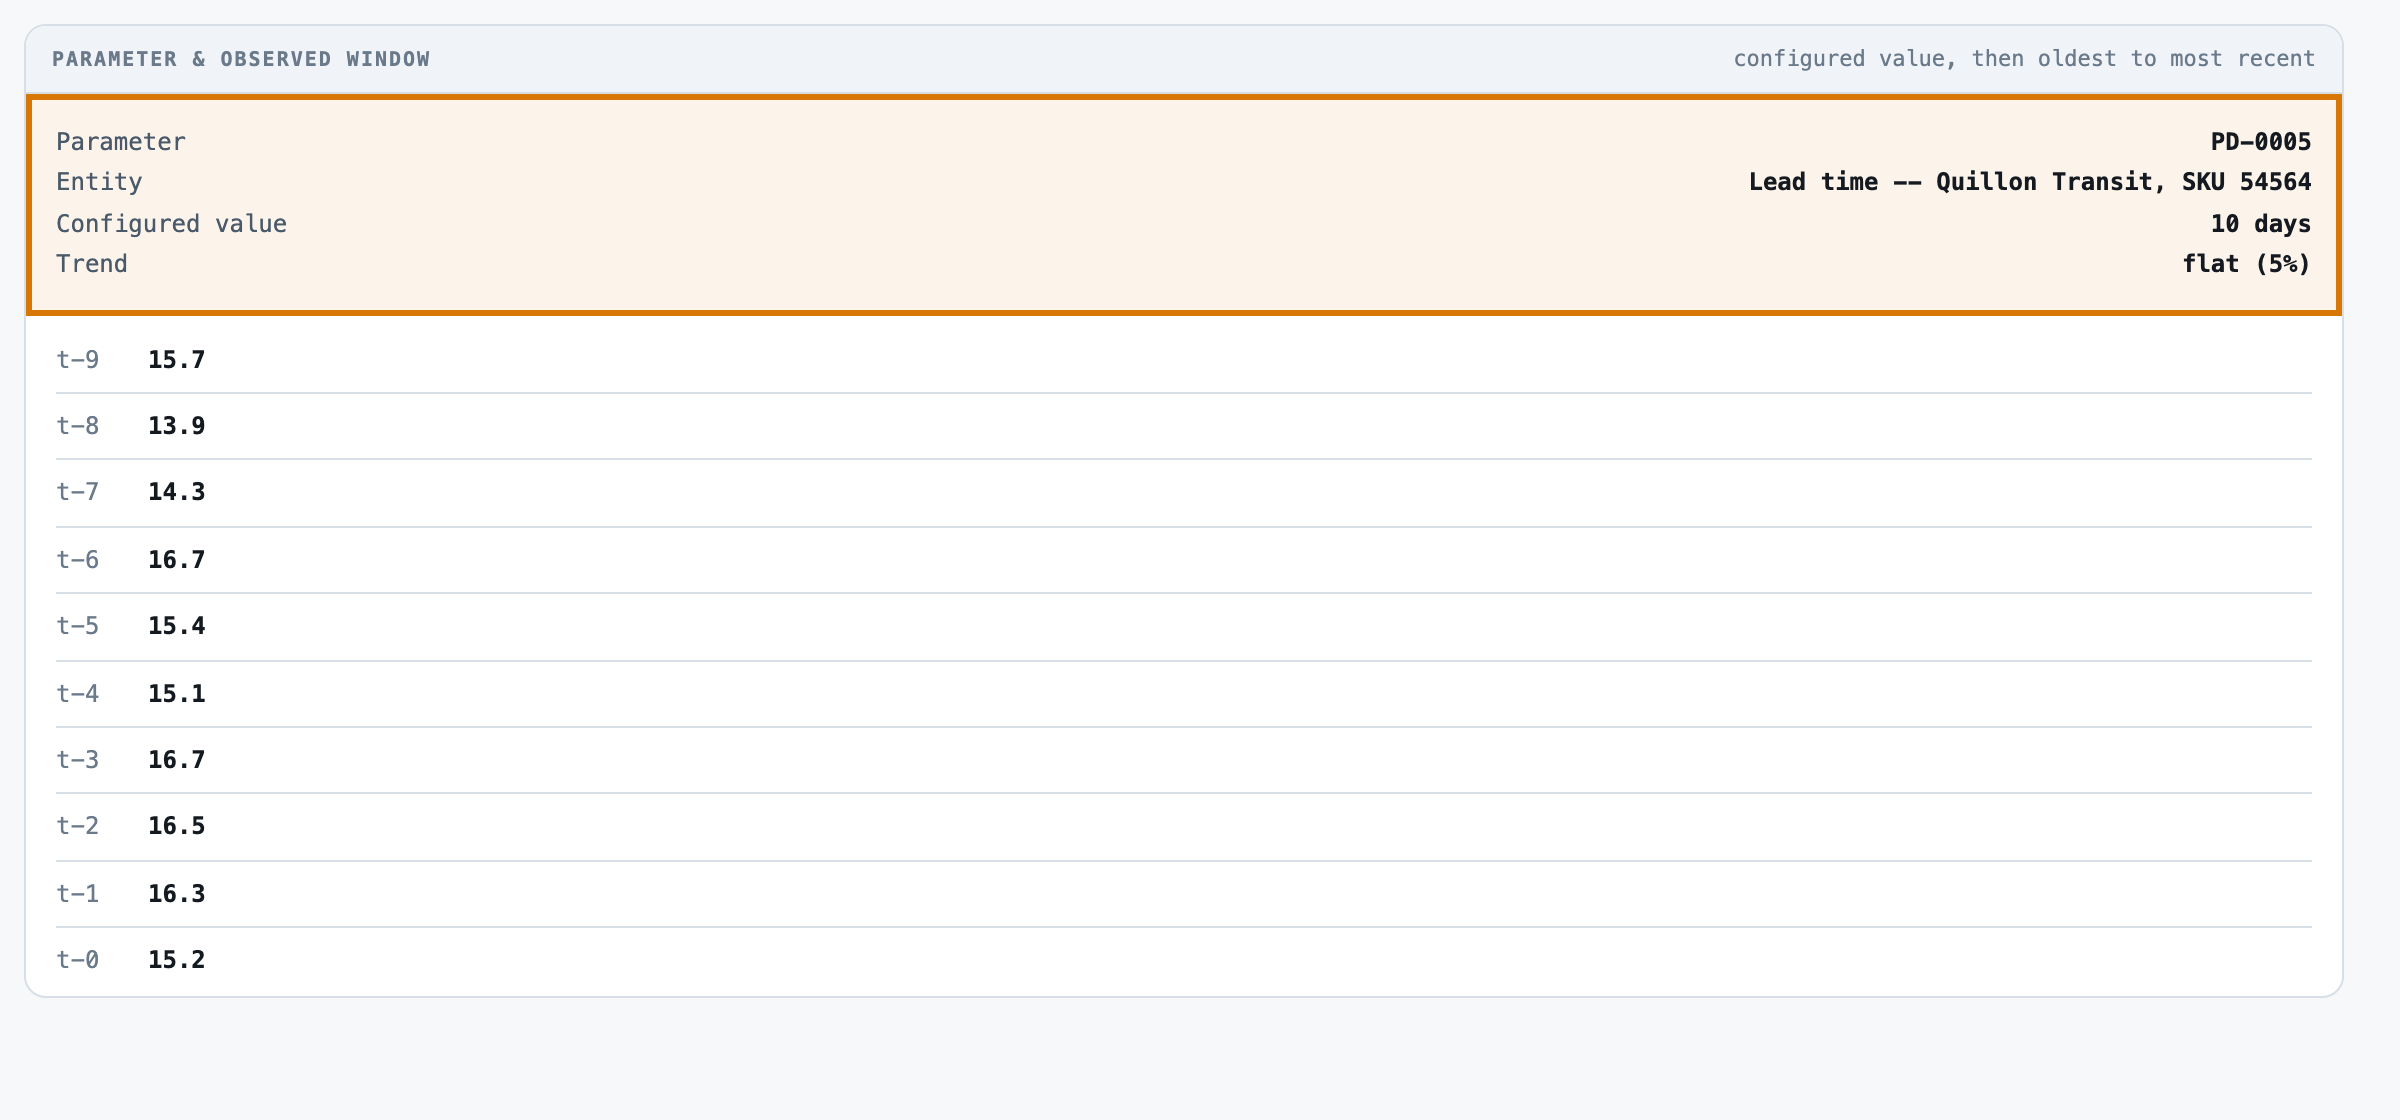
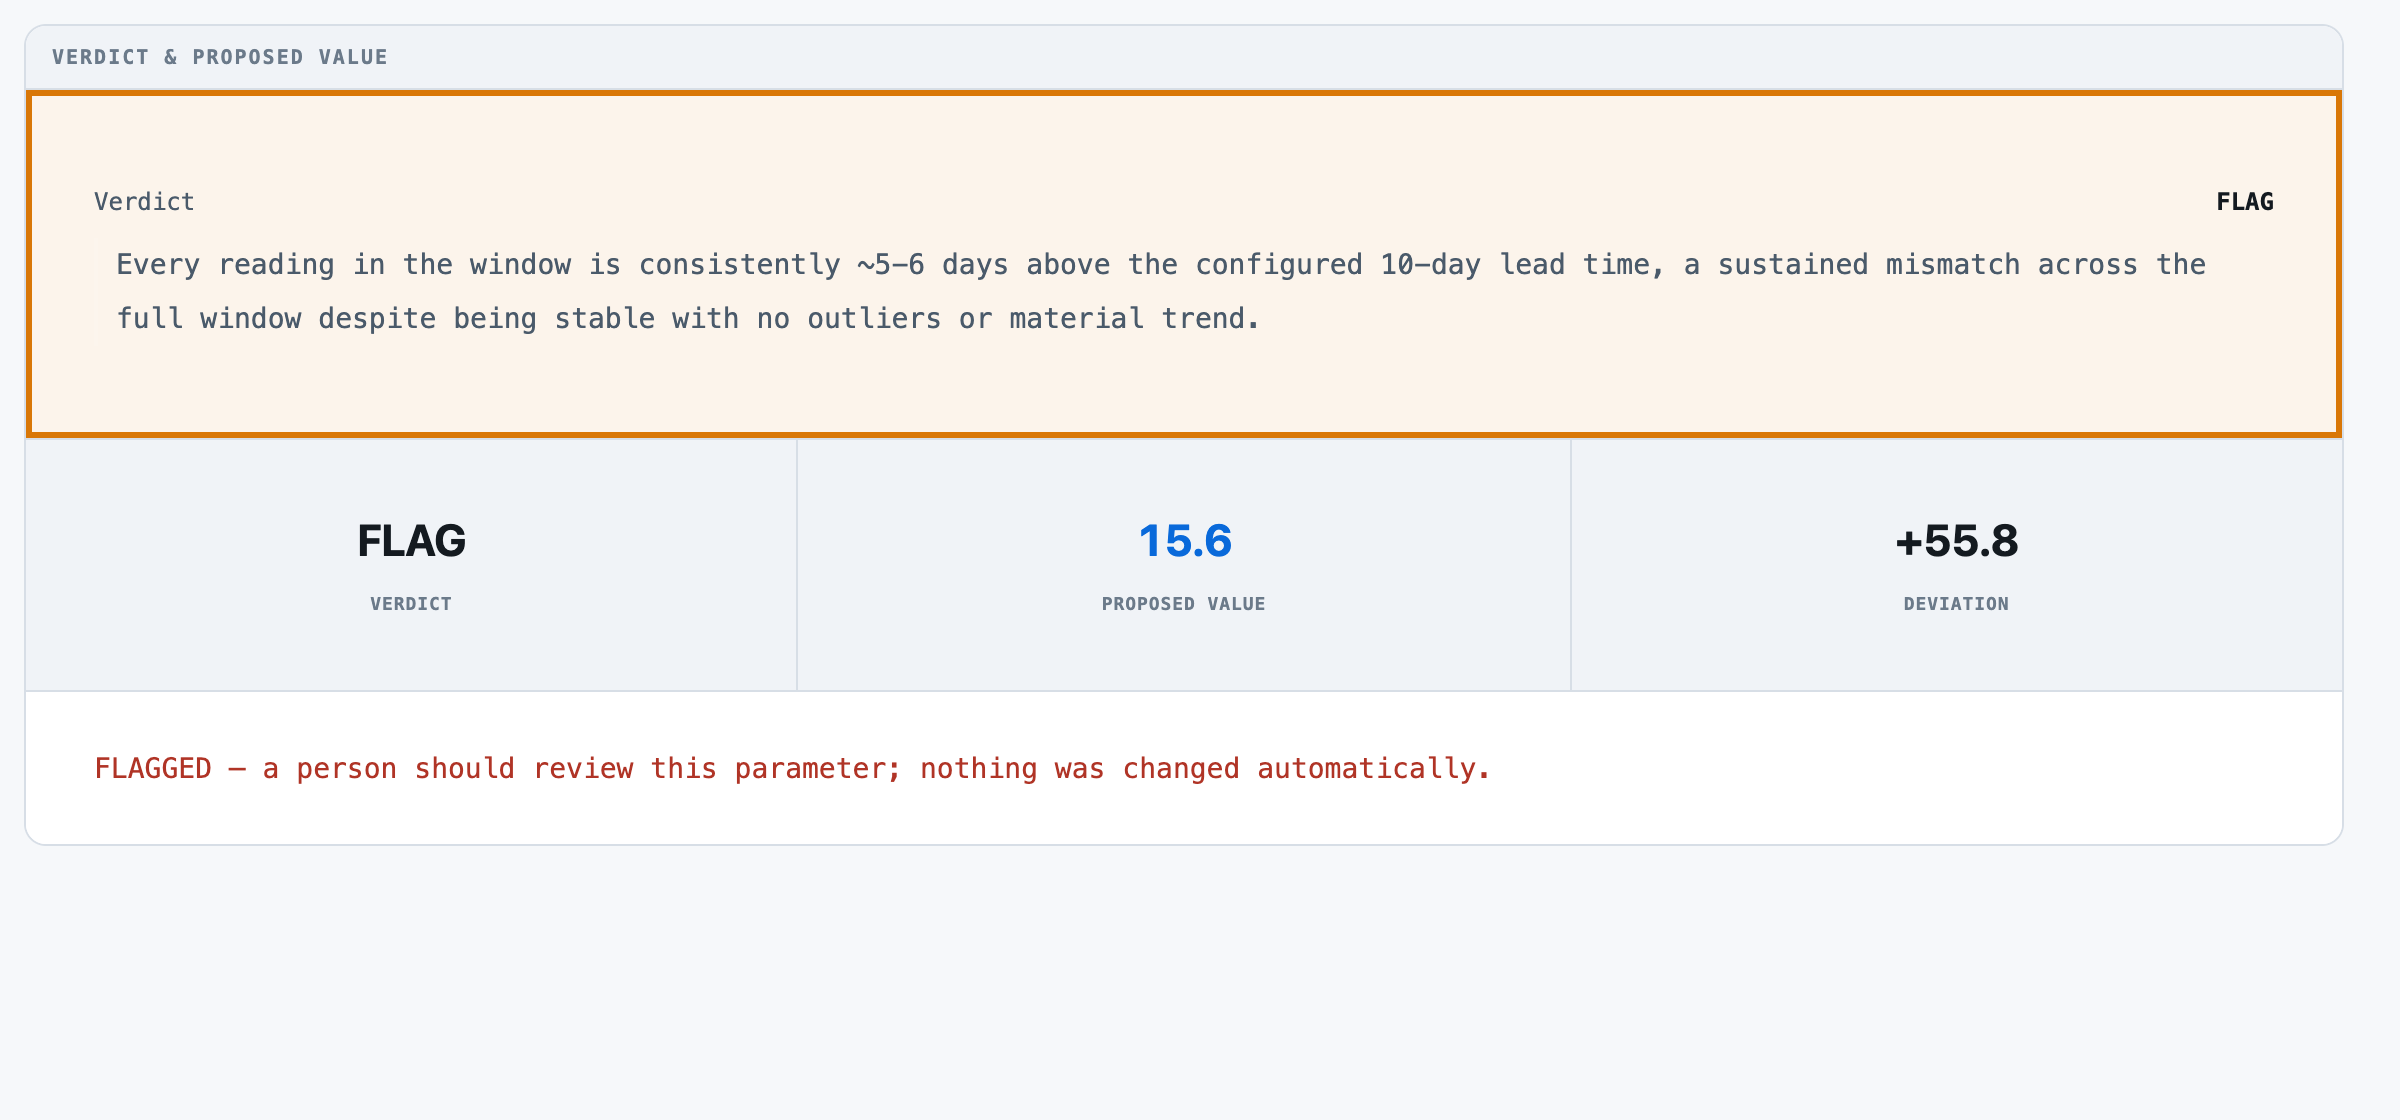
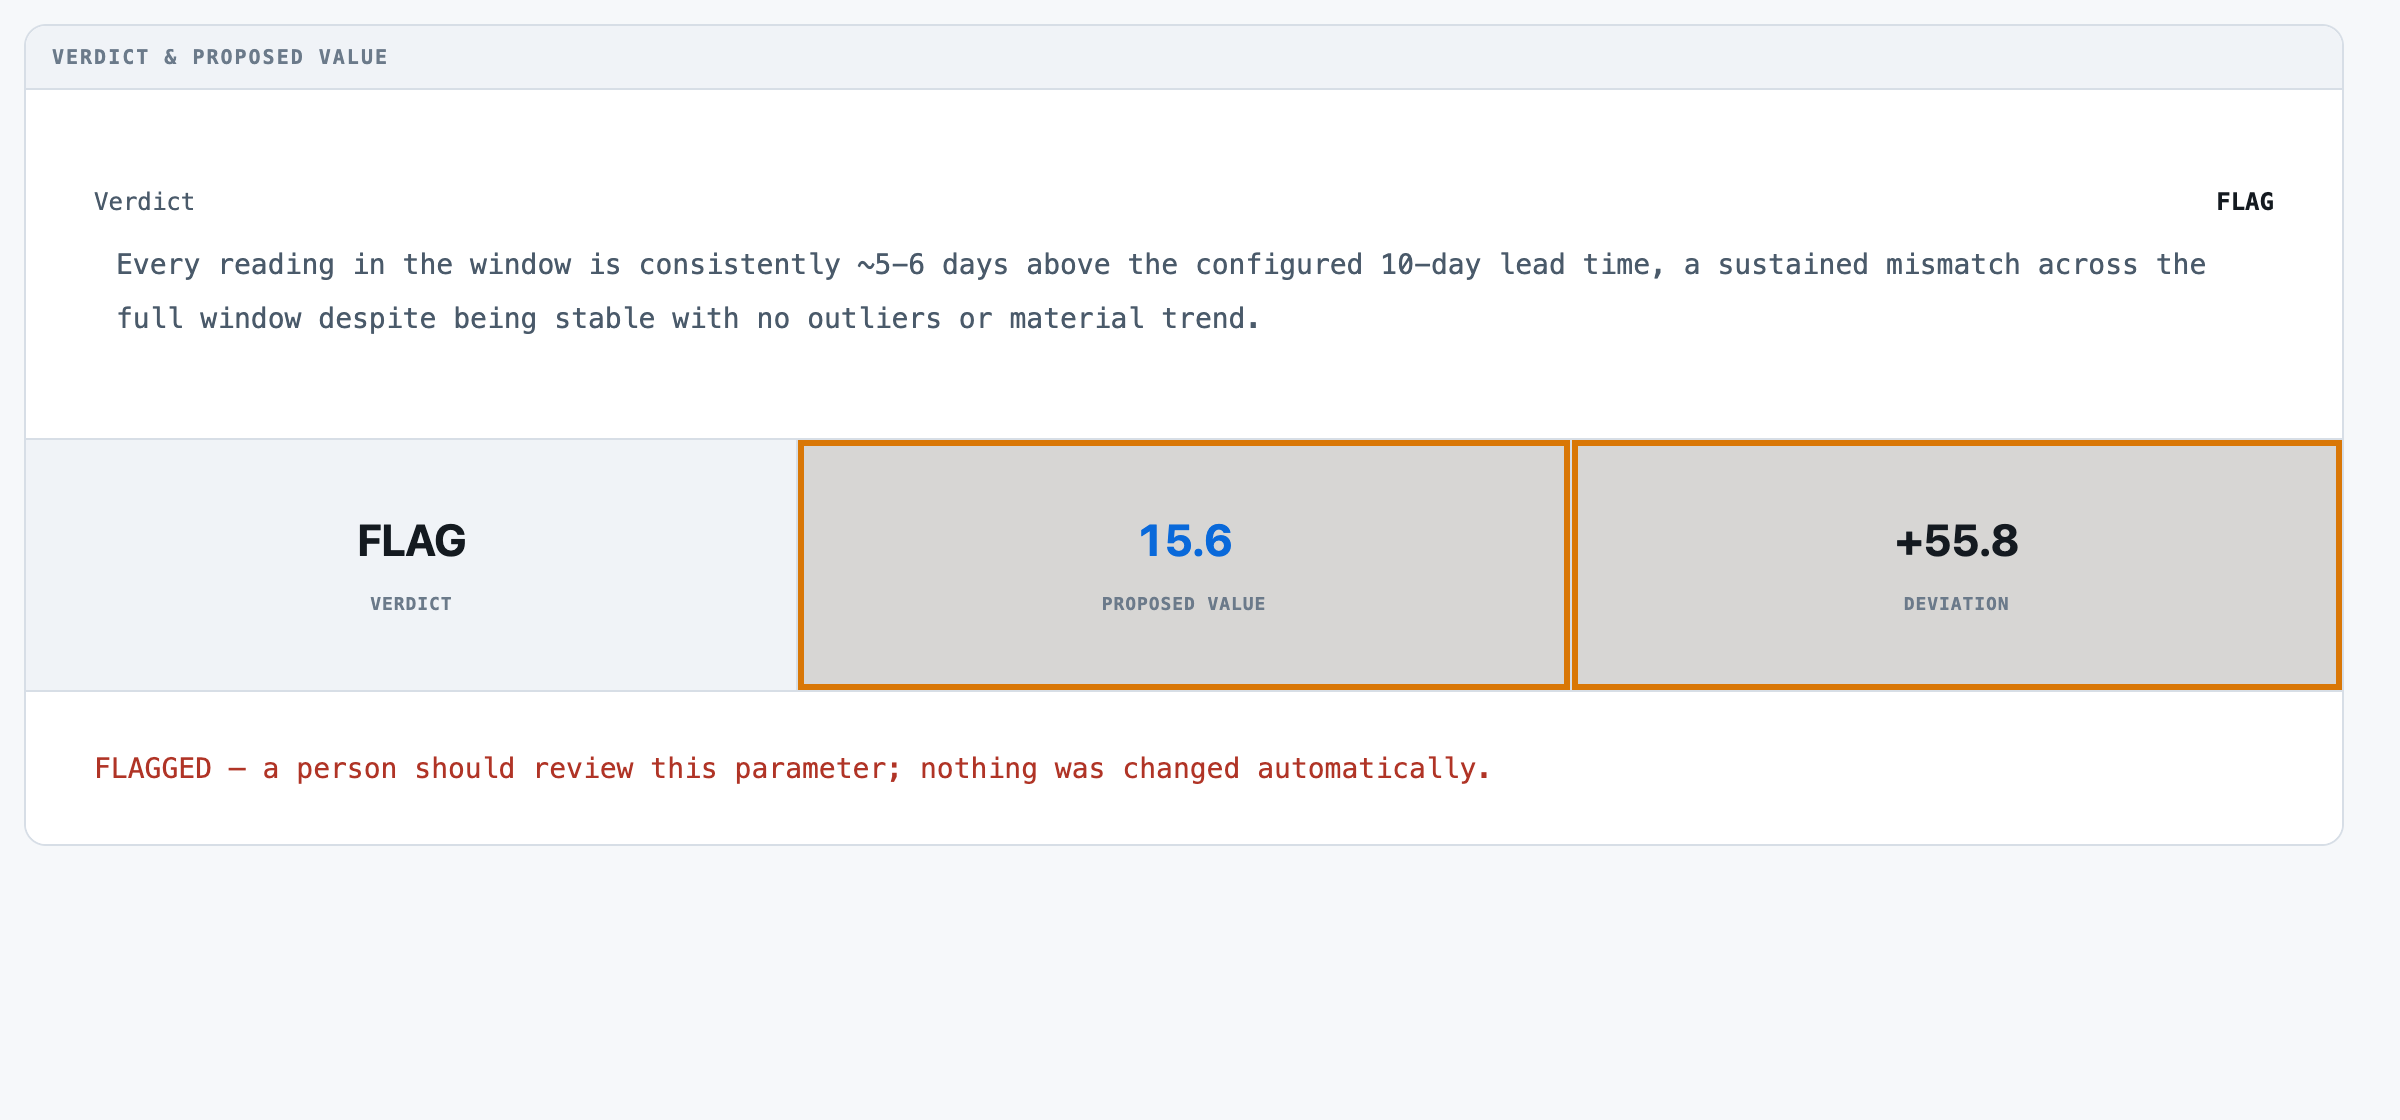
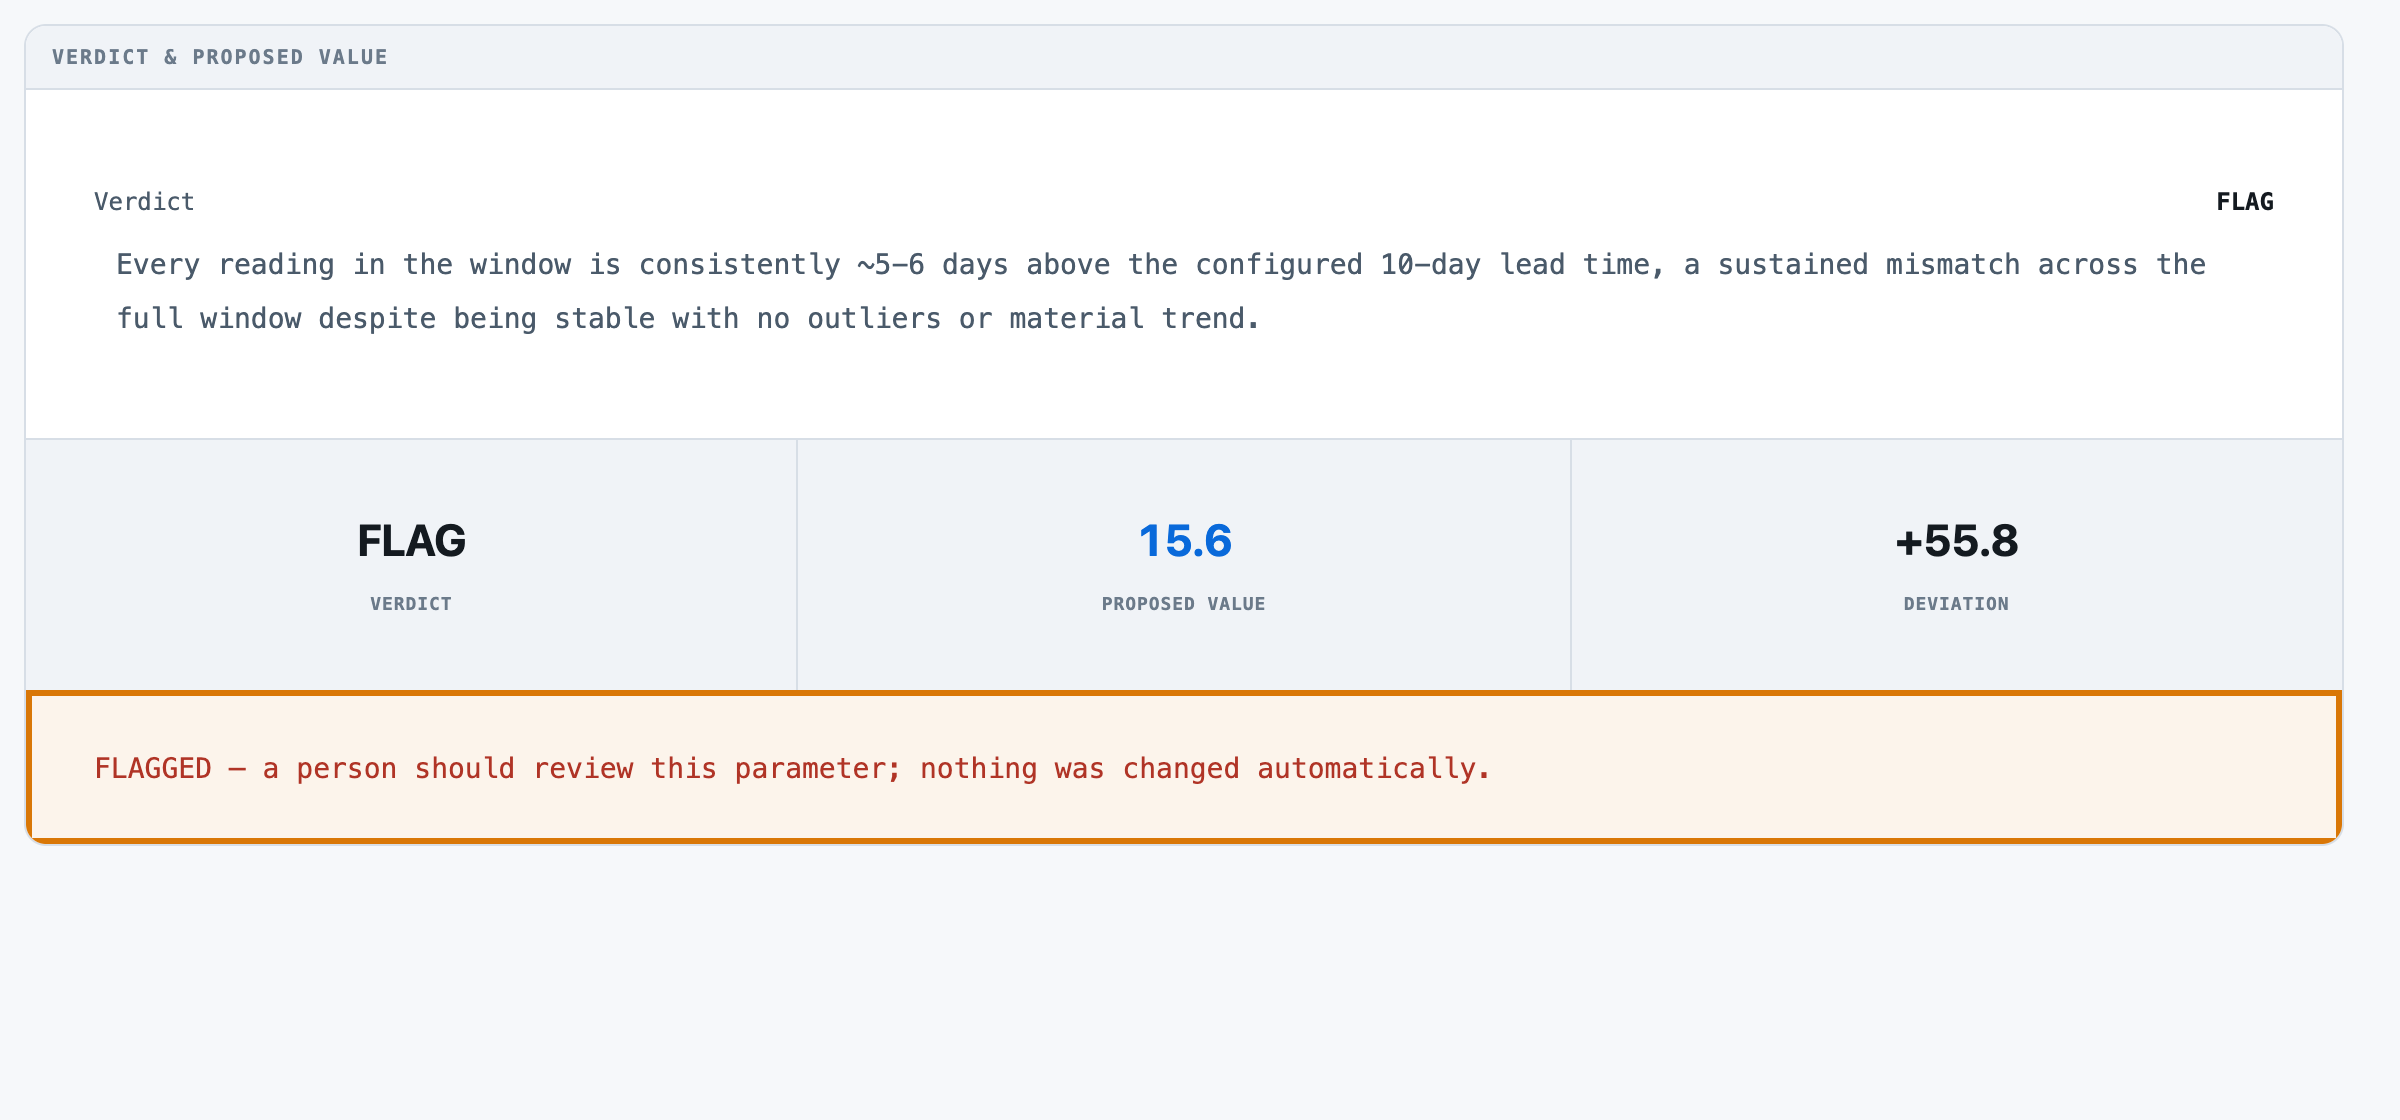
- 1The setting Quillon Transit's lead time for SKU 54564, before the check runs.
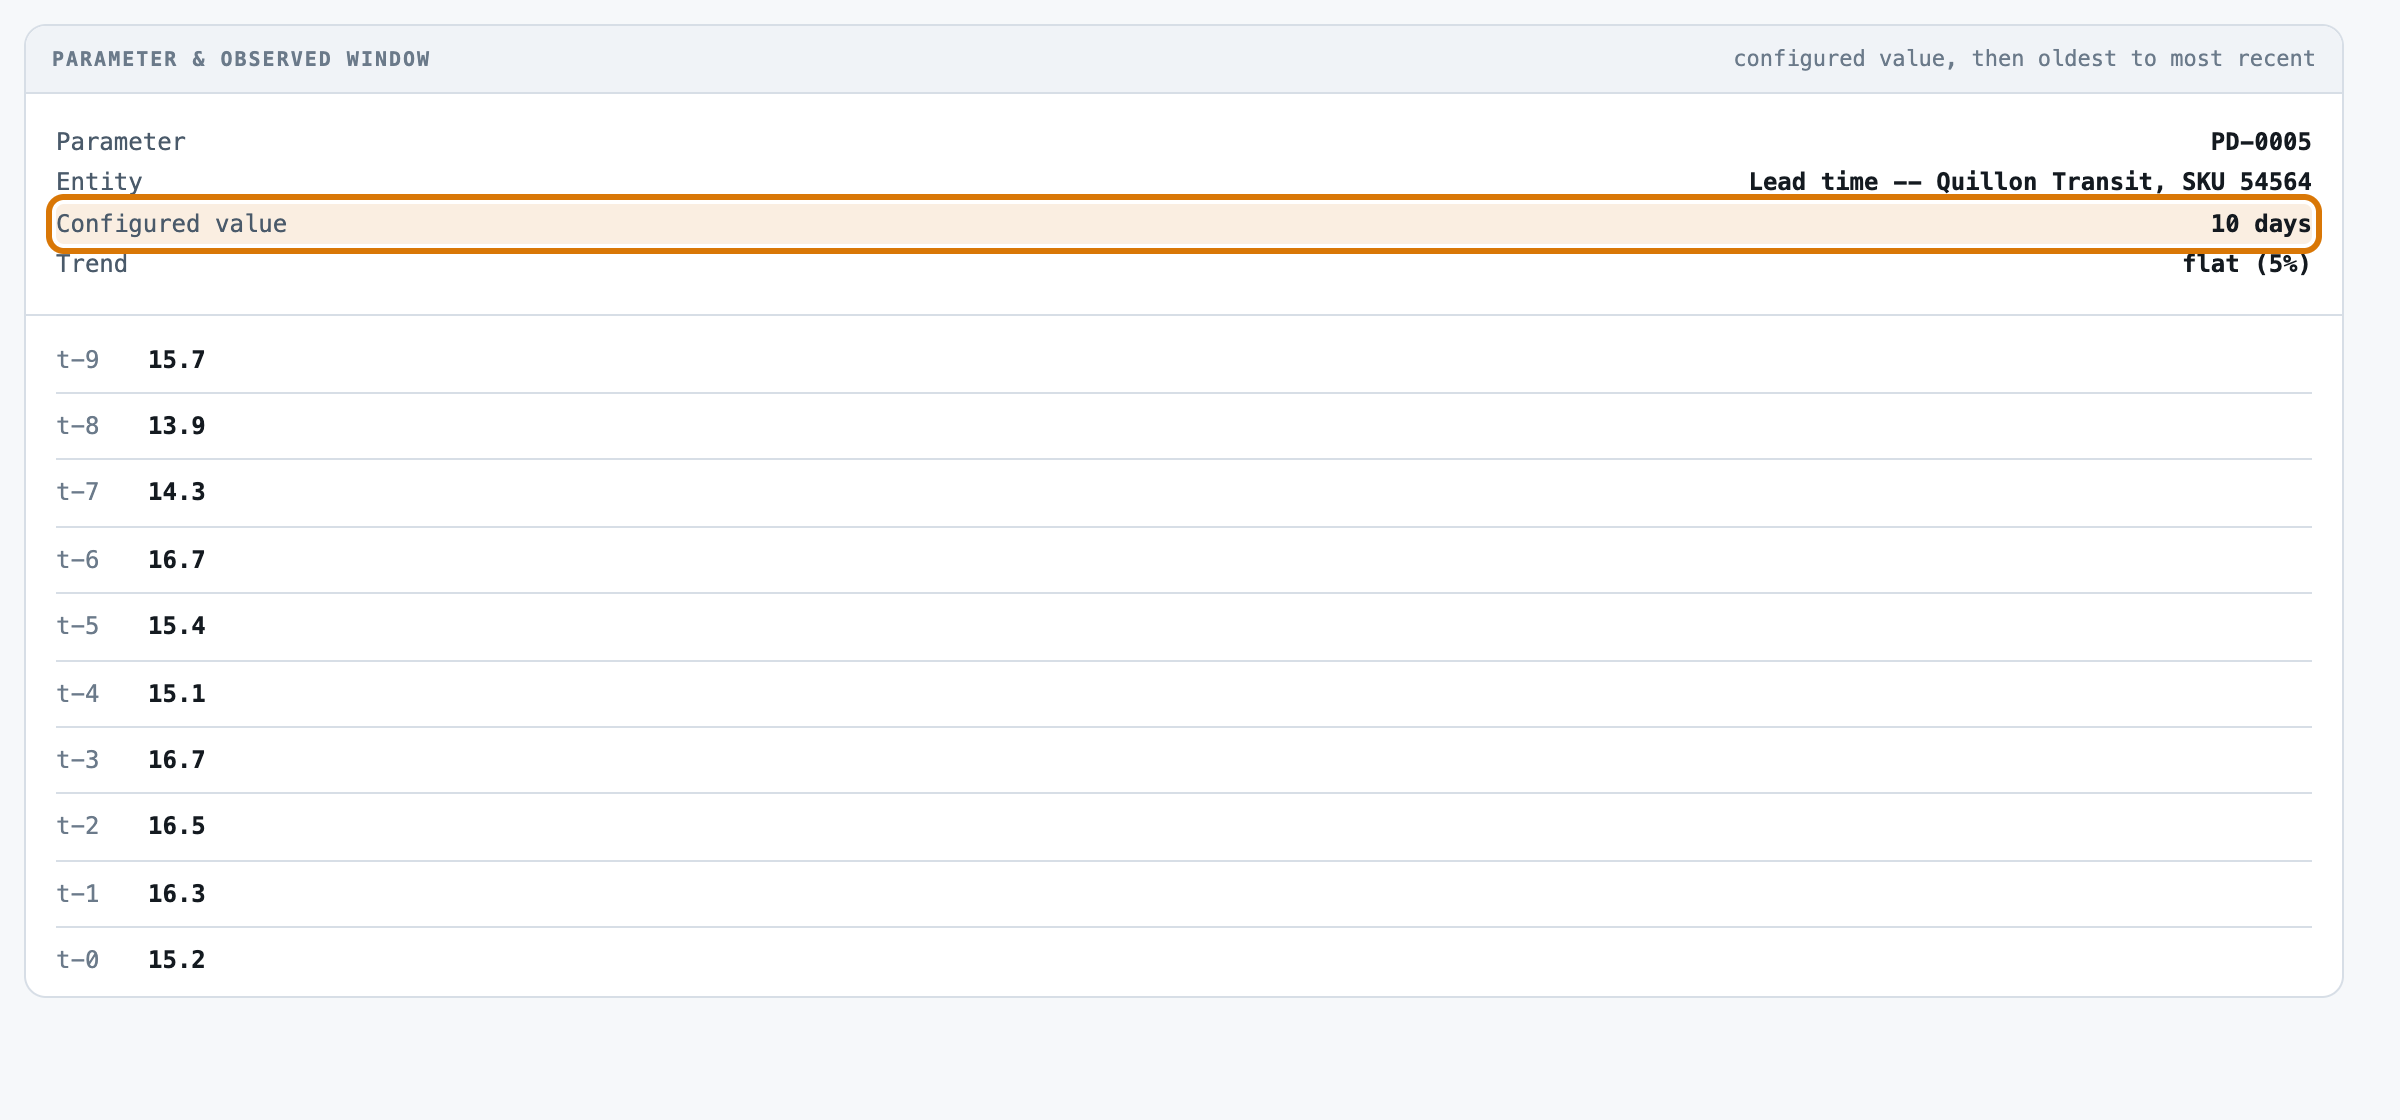
- 2The lead time on file 10 days for this carrier and item.
- 3What really happened ten periods of actual lead times, from 13.9 to 16.7 days.
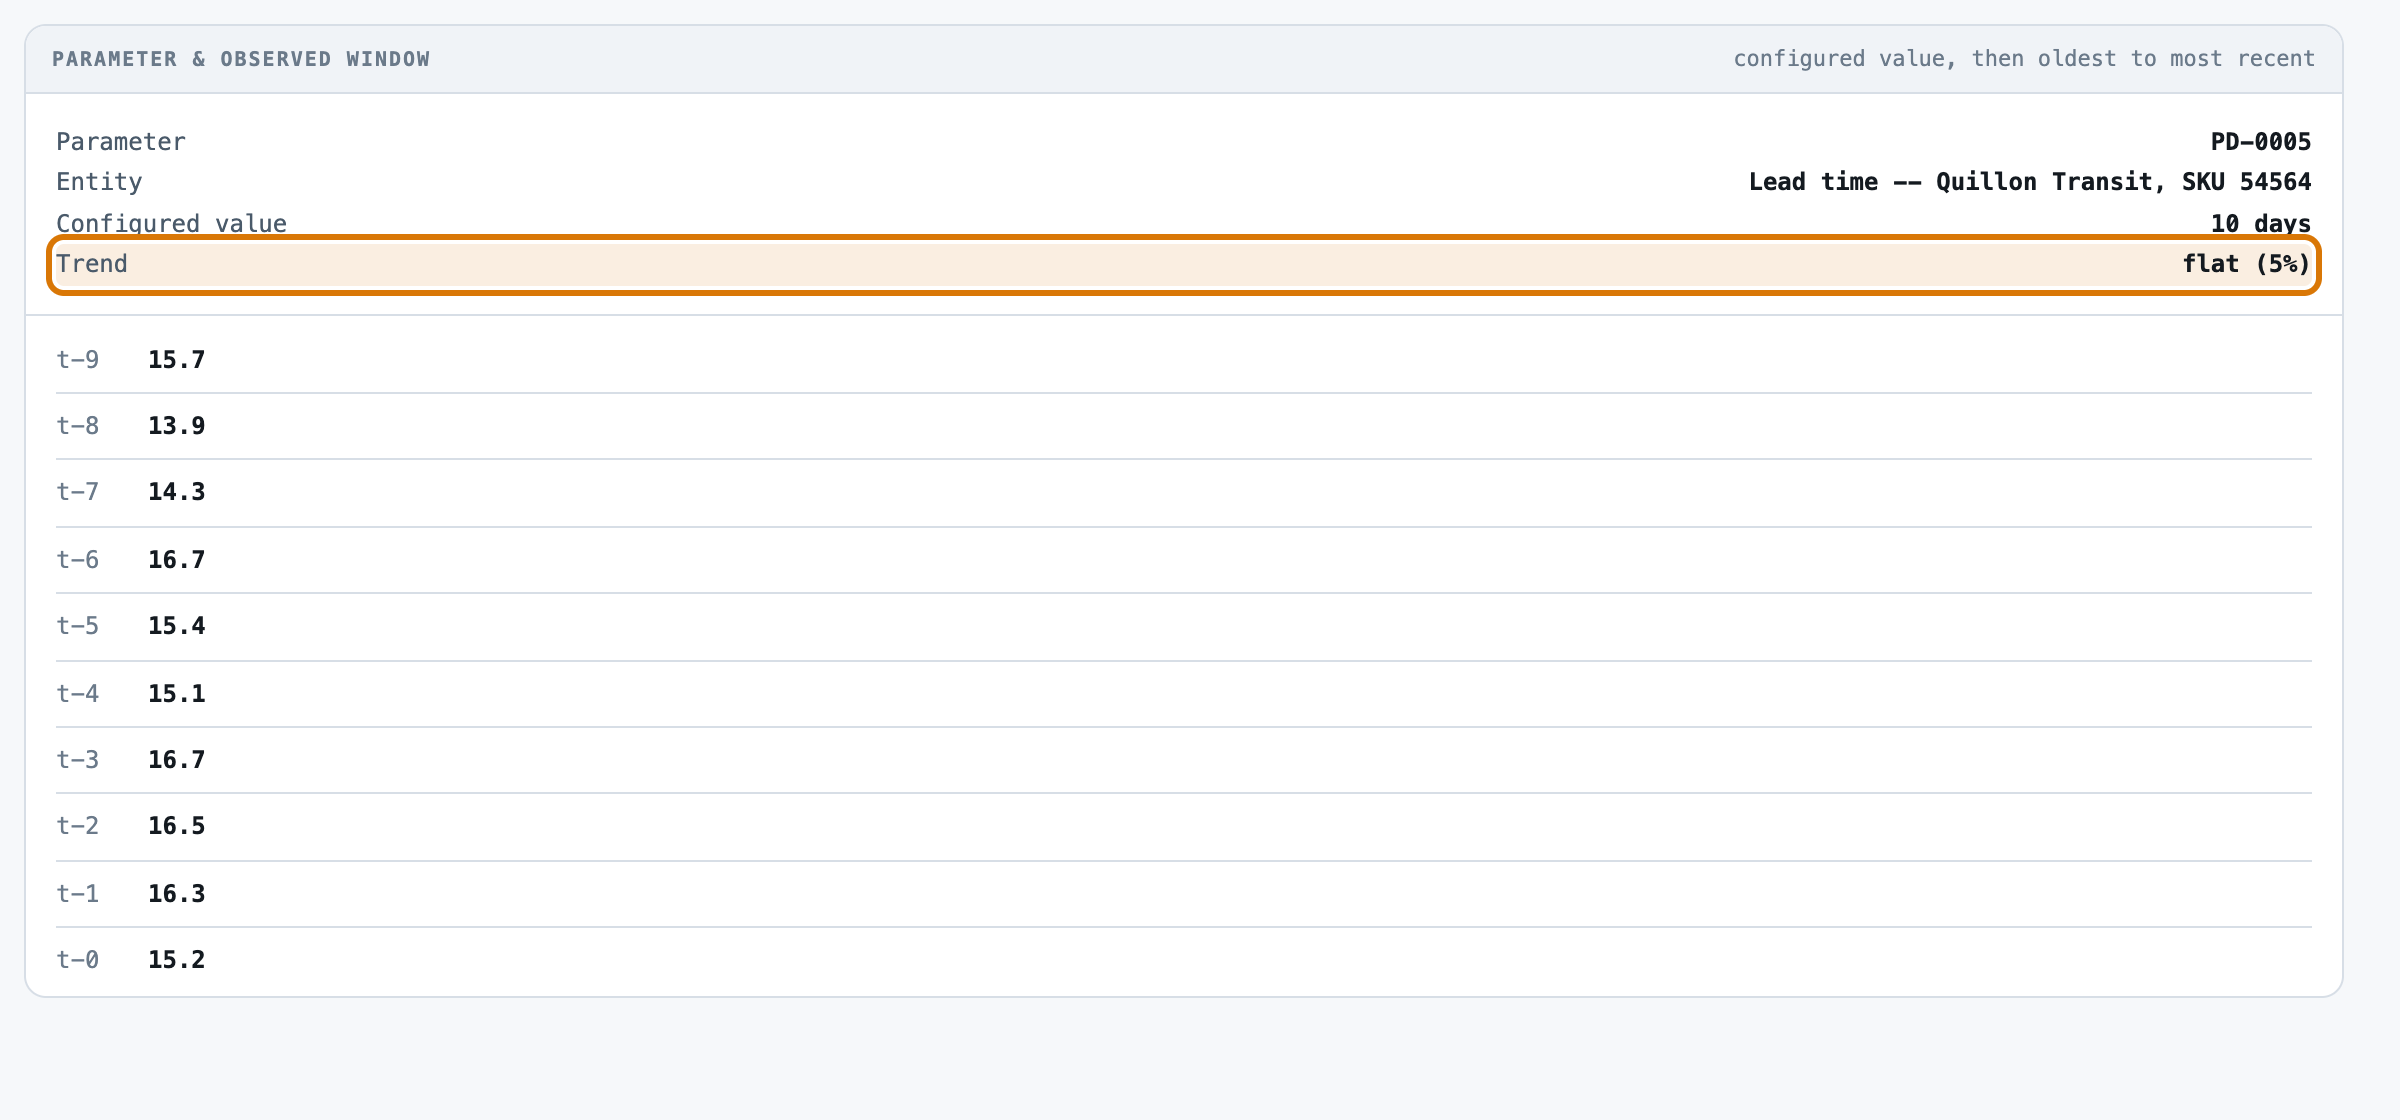
- 4The trend, worked out for you recent periods run 5% above the earlier ones.
- 5The app's call flagged: consistently 5 to 6 days above what's on file.
- 6The suggested value 15.6 days, 55.8% above the number on file.
- 7The outcome flagged for a person to review; nothing changes on its own.
For engineers
How it is built, and how we measured it
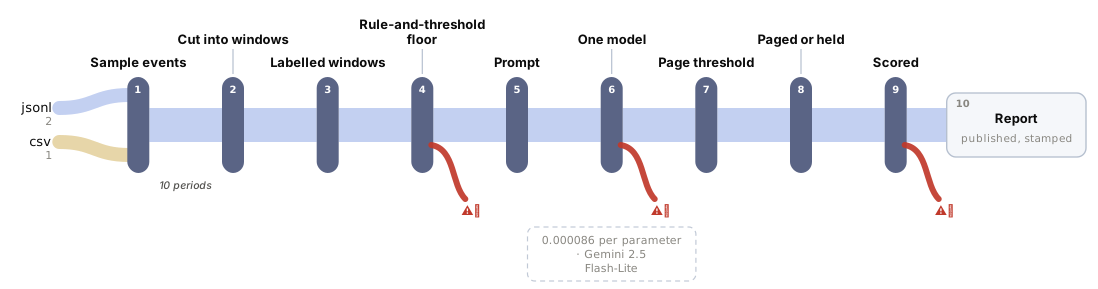
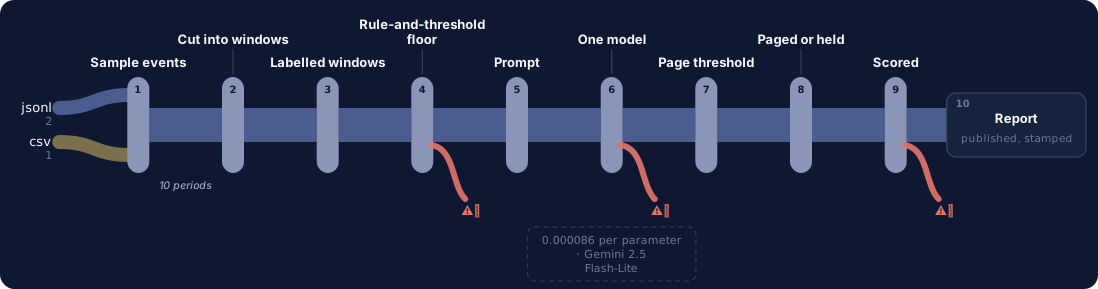
All fourteen steps of the build are written up, from the business case to running it in your own environment.
24 of 27drifted settings flagged for reviewmeasured in 06 Evals →
12 of 36flags on settings that were finemeasured in 06 Evals →
17 of 24suggested values close to the correct onemeasured in 06 Evals →
0.5¢to check all 60 settingsmeasured in 07 Unit cost →
The build, step by step
14 steps06 Evals · the graders
Make it yours
What you see is a reference app. We shape it to how you work.
Every part of it is built to change, and none of it means starting over.
Your rulesHow far each kind of setting may drift before a flag, and how new values are worked out.
Your recordsYour own lead times, safety stock and service targets, and the history you already keep.
Your systemsSettings and history read from your planning system, flags sent where your planners already work.
Your screensThe setting names, fields and wording your planners already use.
Want this for your team?
Talk to us
We can run this on your own lead times and stock settings, with your own limits, inside your environment.
Talk to us →