Your forecast flags products whose store sales suddenly broke from plan. Before the weekly review, someone digs through sales, stock-outs, promotions and last year manually. This app gathers that evidence, names the likely reason and drafts the review notes.
PresenterOpens the private repo. Visible to admins only.
For the demand plannerCross-domain · Retail
Why it matters
Today's manual process, and the same job with the app
A demand planner at a retail chain, preparing the weekly forecast review.
✕Today's manual process
1Pull the evidence forecast, actual sales, stockouts, the promo calendar and last year's numbers, one item at a time.
2Read the notes log to work out why each item moved, line by line.
3Write the narrative for the review meeting, from memory and a stack of tabs.
4Miss one exception and the meeting spends its time on the wrong number.
Every batch worked manually
✓With the app
1The evidence is pulled and lined up for every flagged item before the meeting starts.
2A likely cause is named from the notes log, or marked unknown, never guessed.
3The narrative is drafted for the meeting, each line tied back to its source.
4Every material exception is itemized so the meeting starts with the full list, not a guess.
The evidence and cause ready before the meeting
See it work
One real case, read by the app, step by step
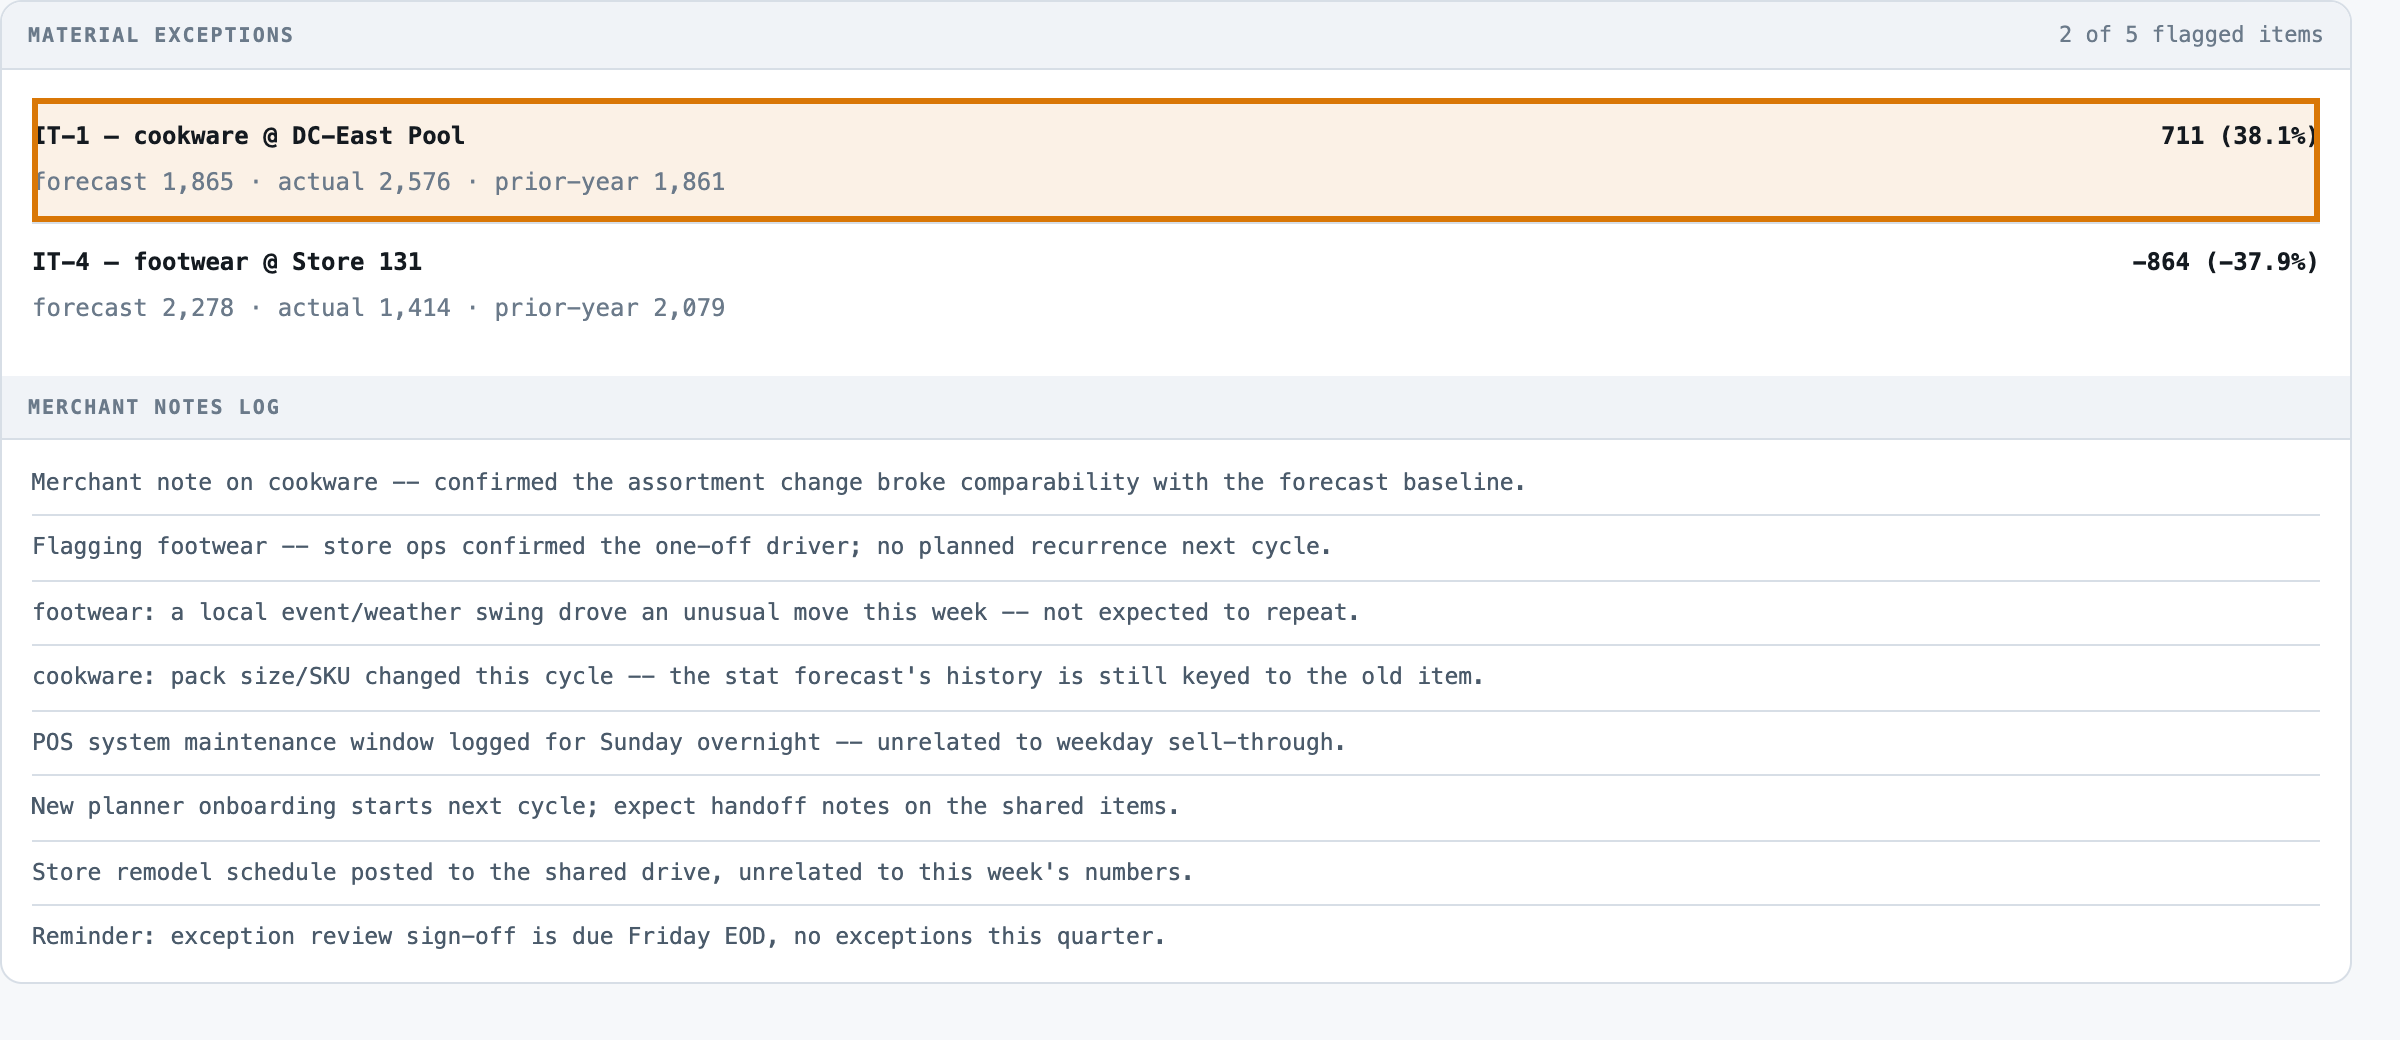
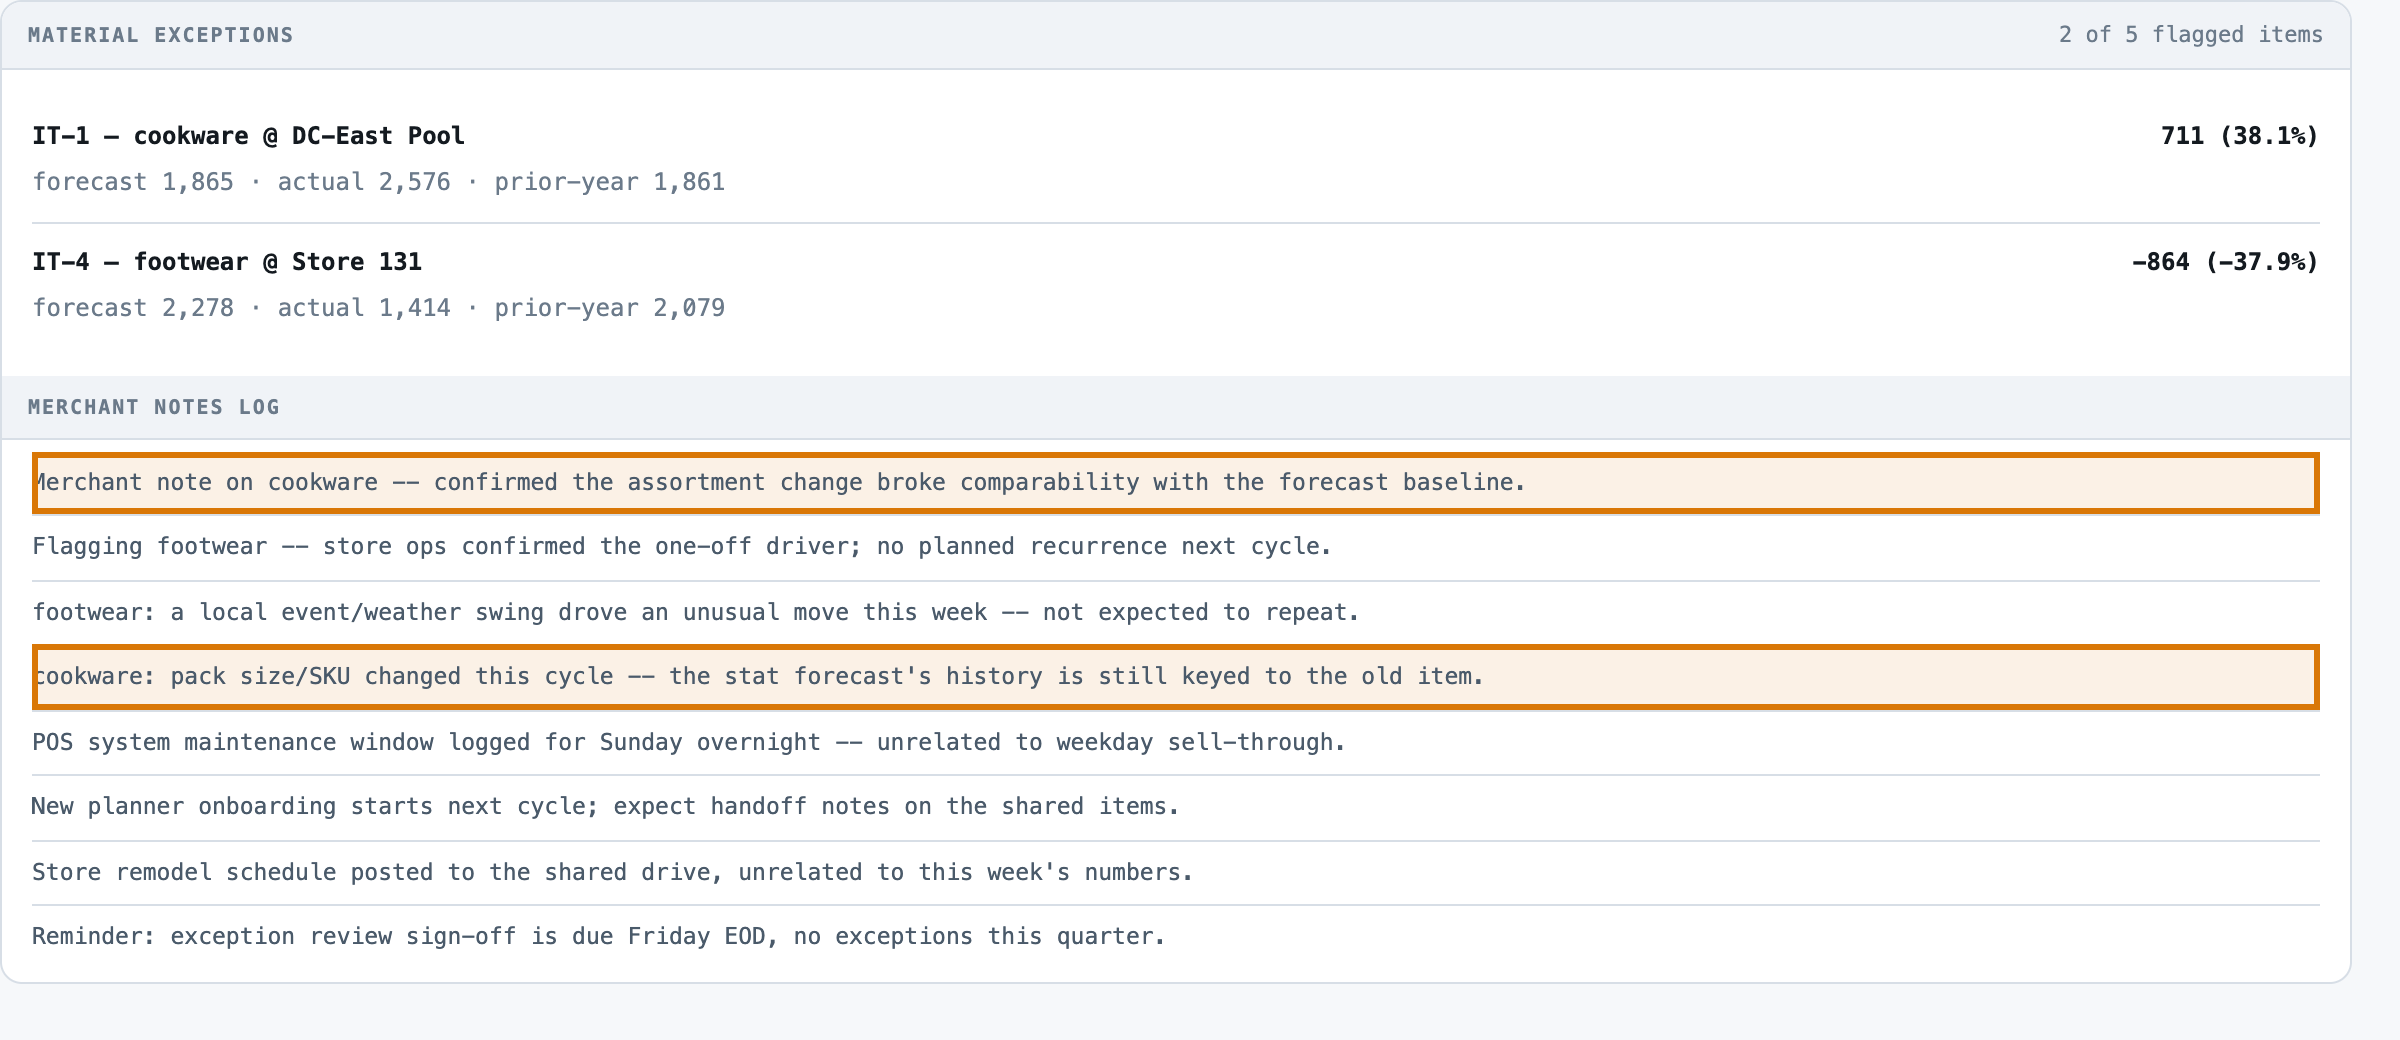
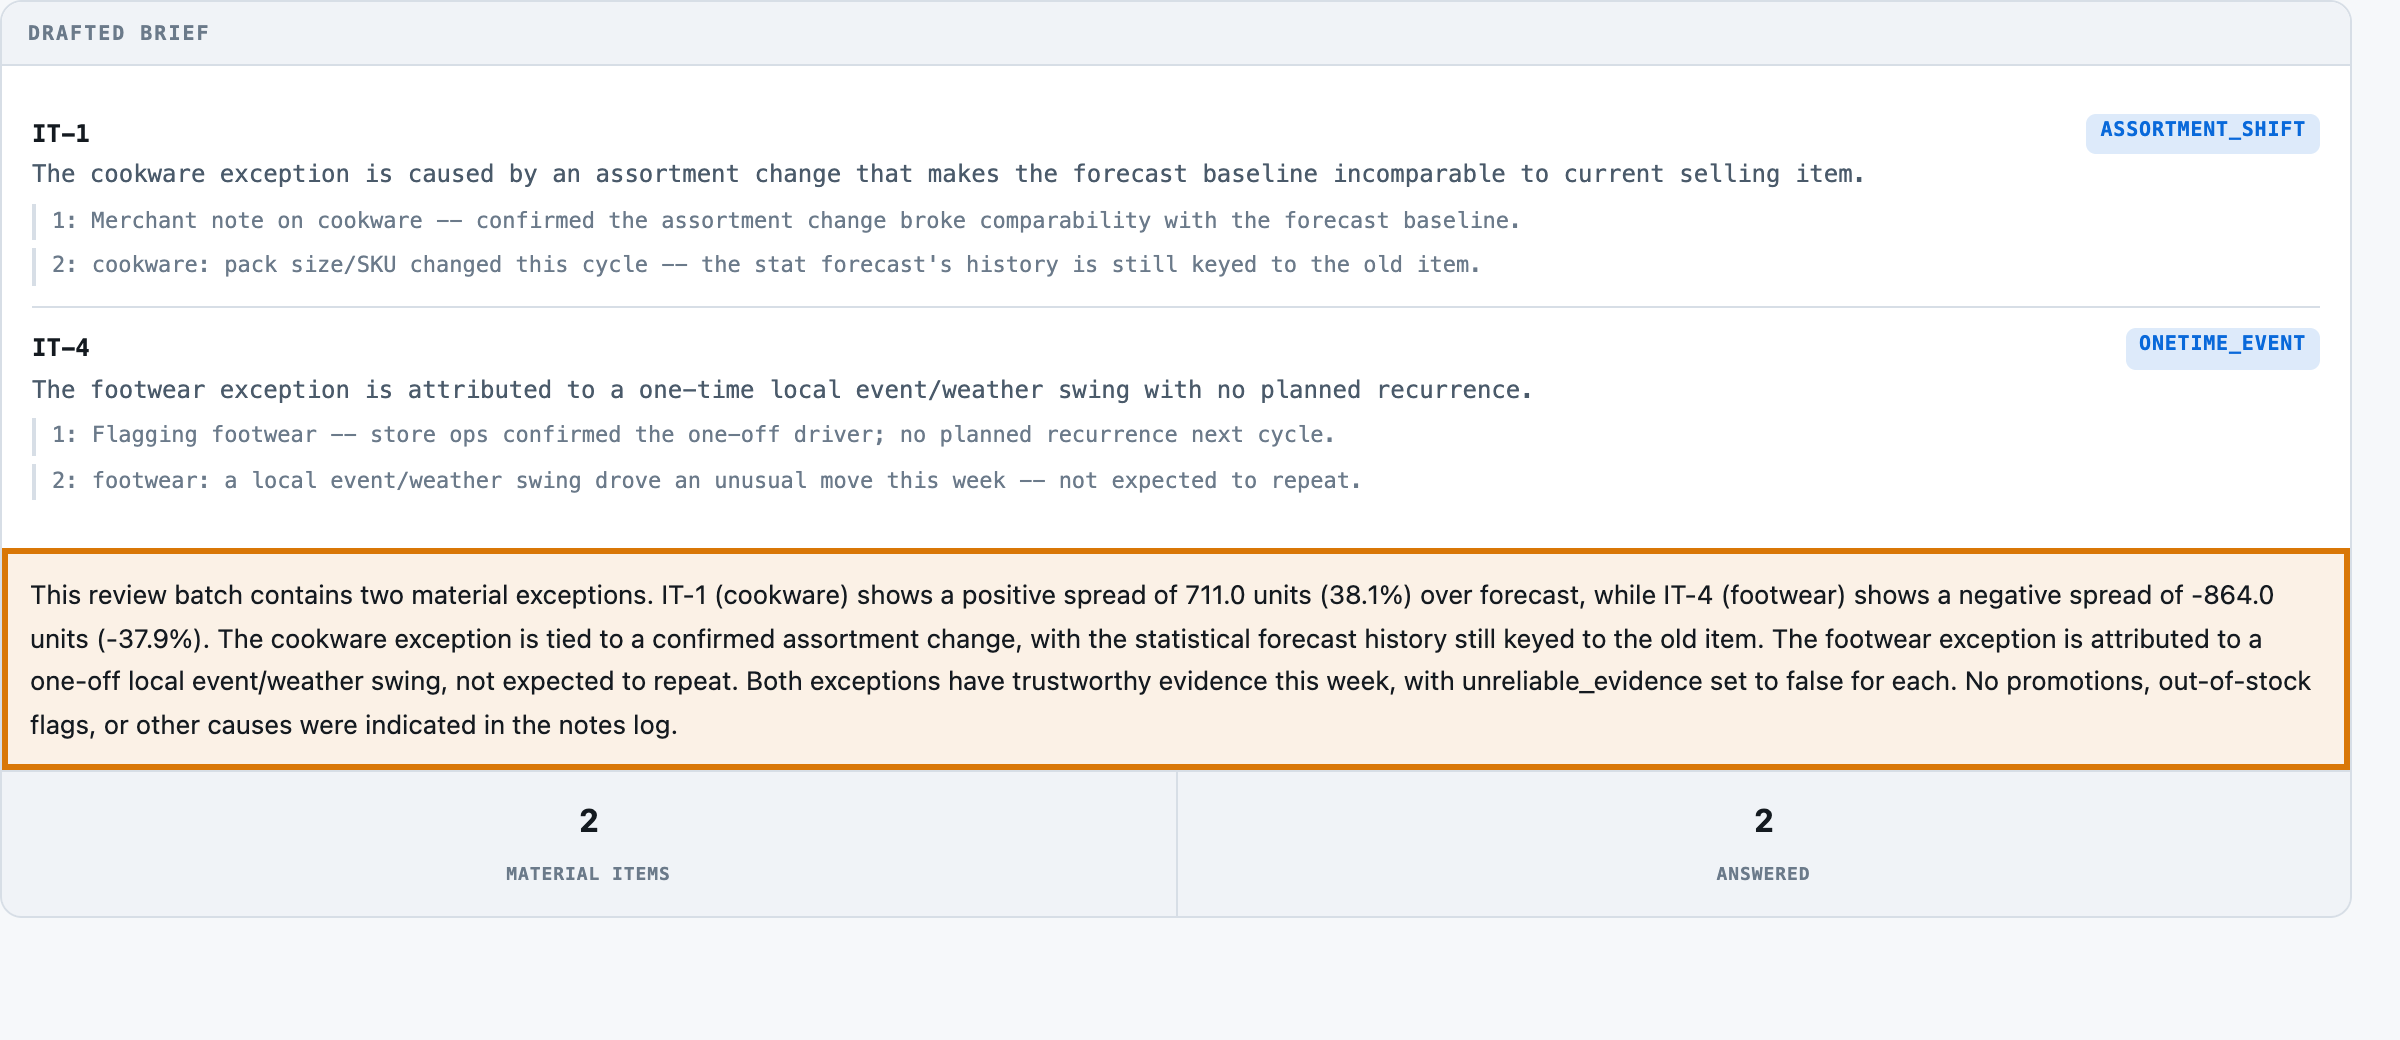
At DC-East, a cookware item came in 38% over forecast, and the merchant's note explains a SKU change the forecast never saw.
Explain why store sales broke from the forecastReference appBuilt to be shaped to your process
5
1The flagged item Cookware at DC-East Pool, 711 units (38.1%) over its forecast.
2The evidence it cites The two merchant notes behind it: the assortment change and the SKU change.
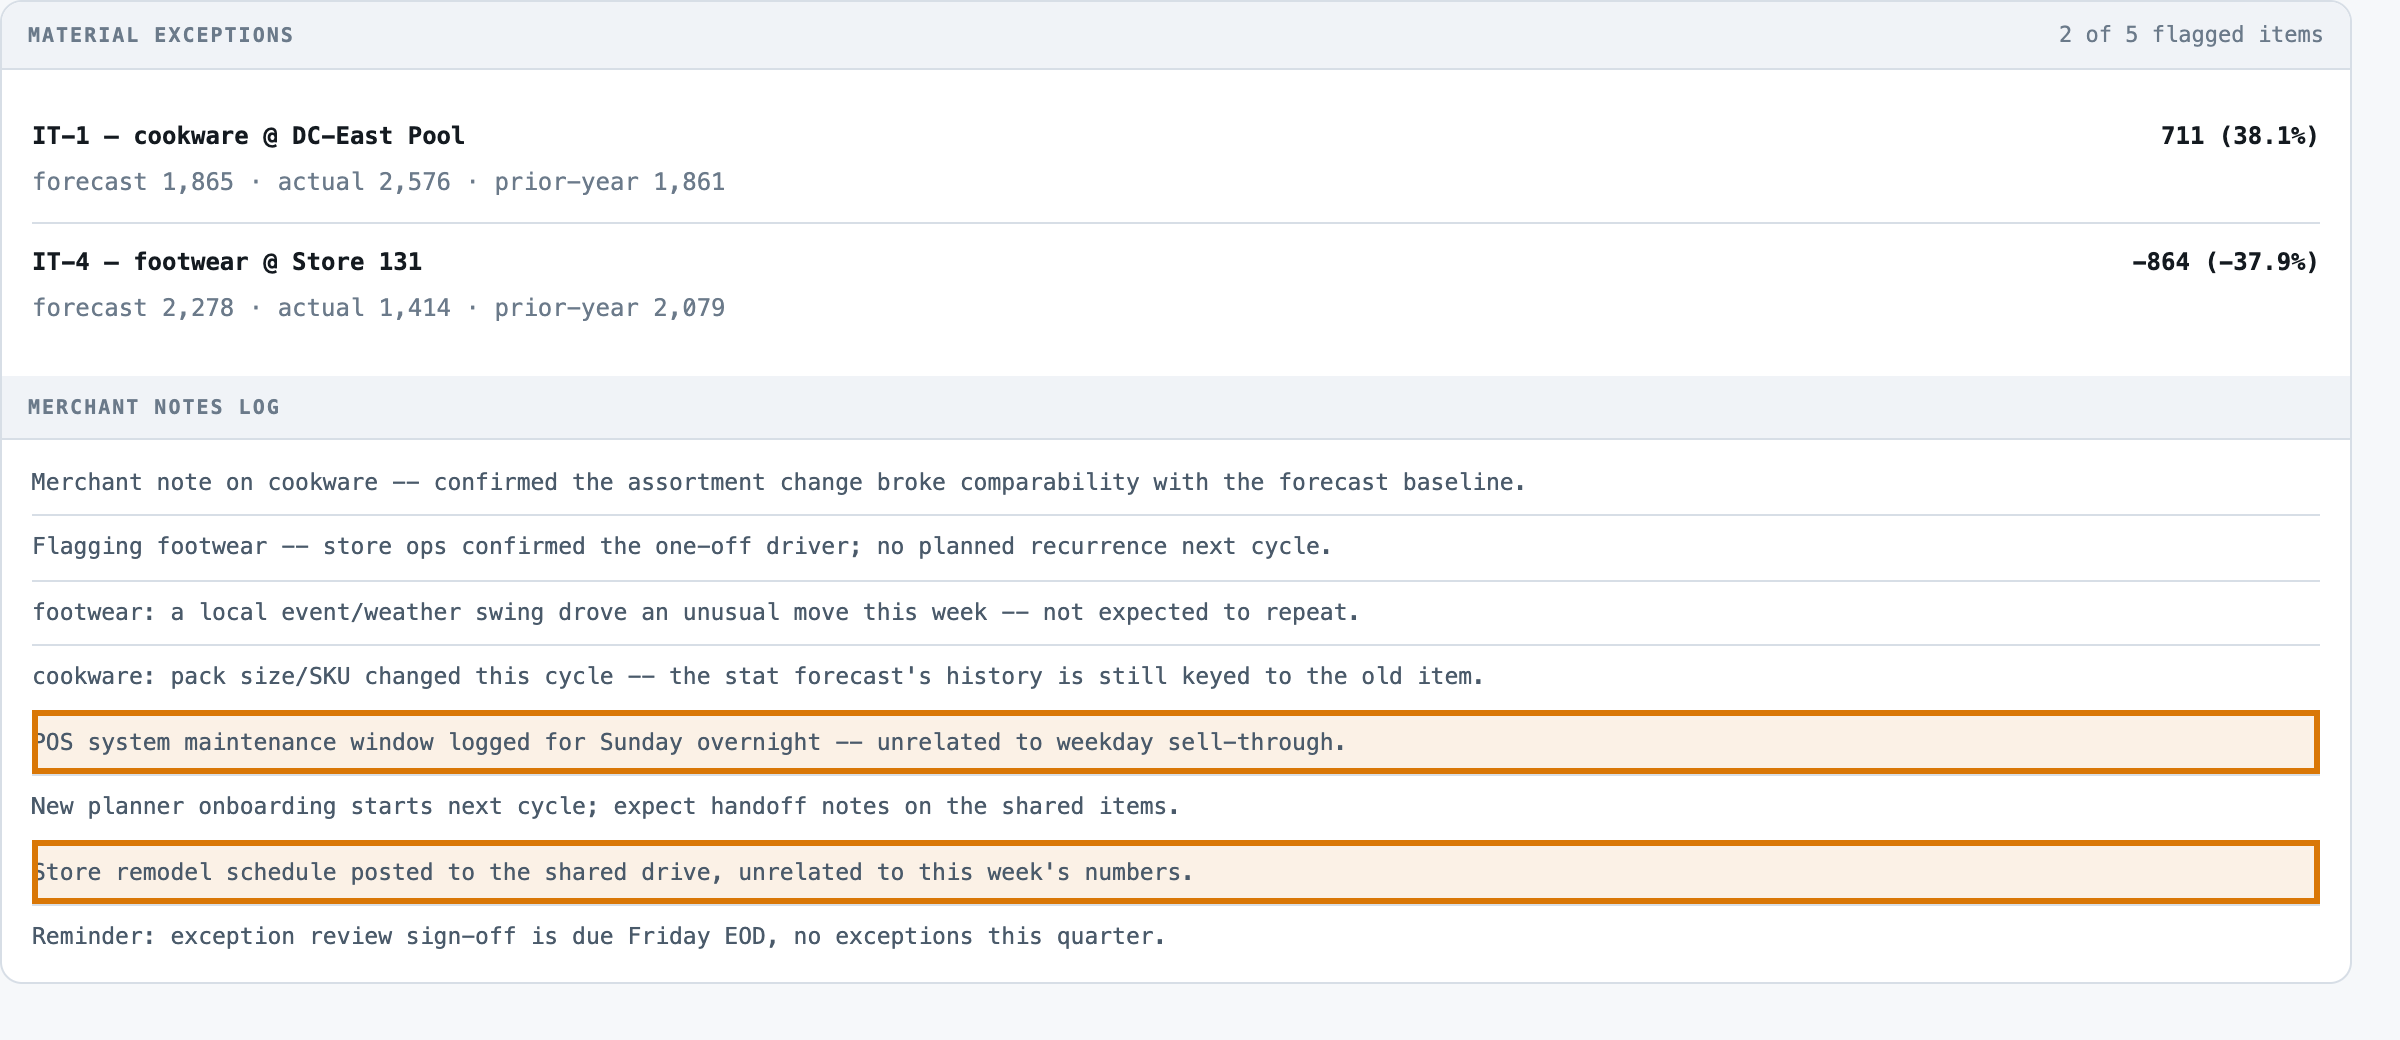
3Not the reason Two notes logged the same week, but the app marks them unrelated.
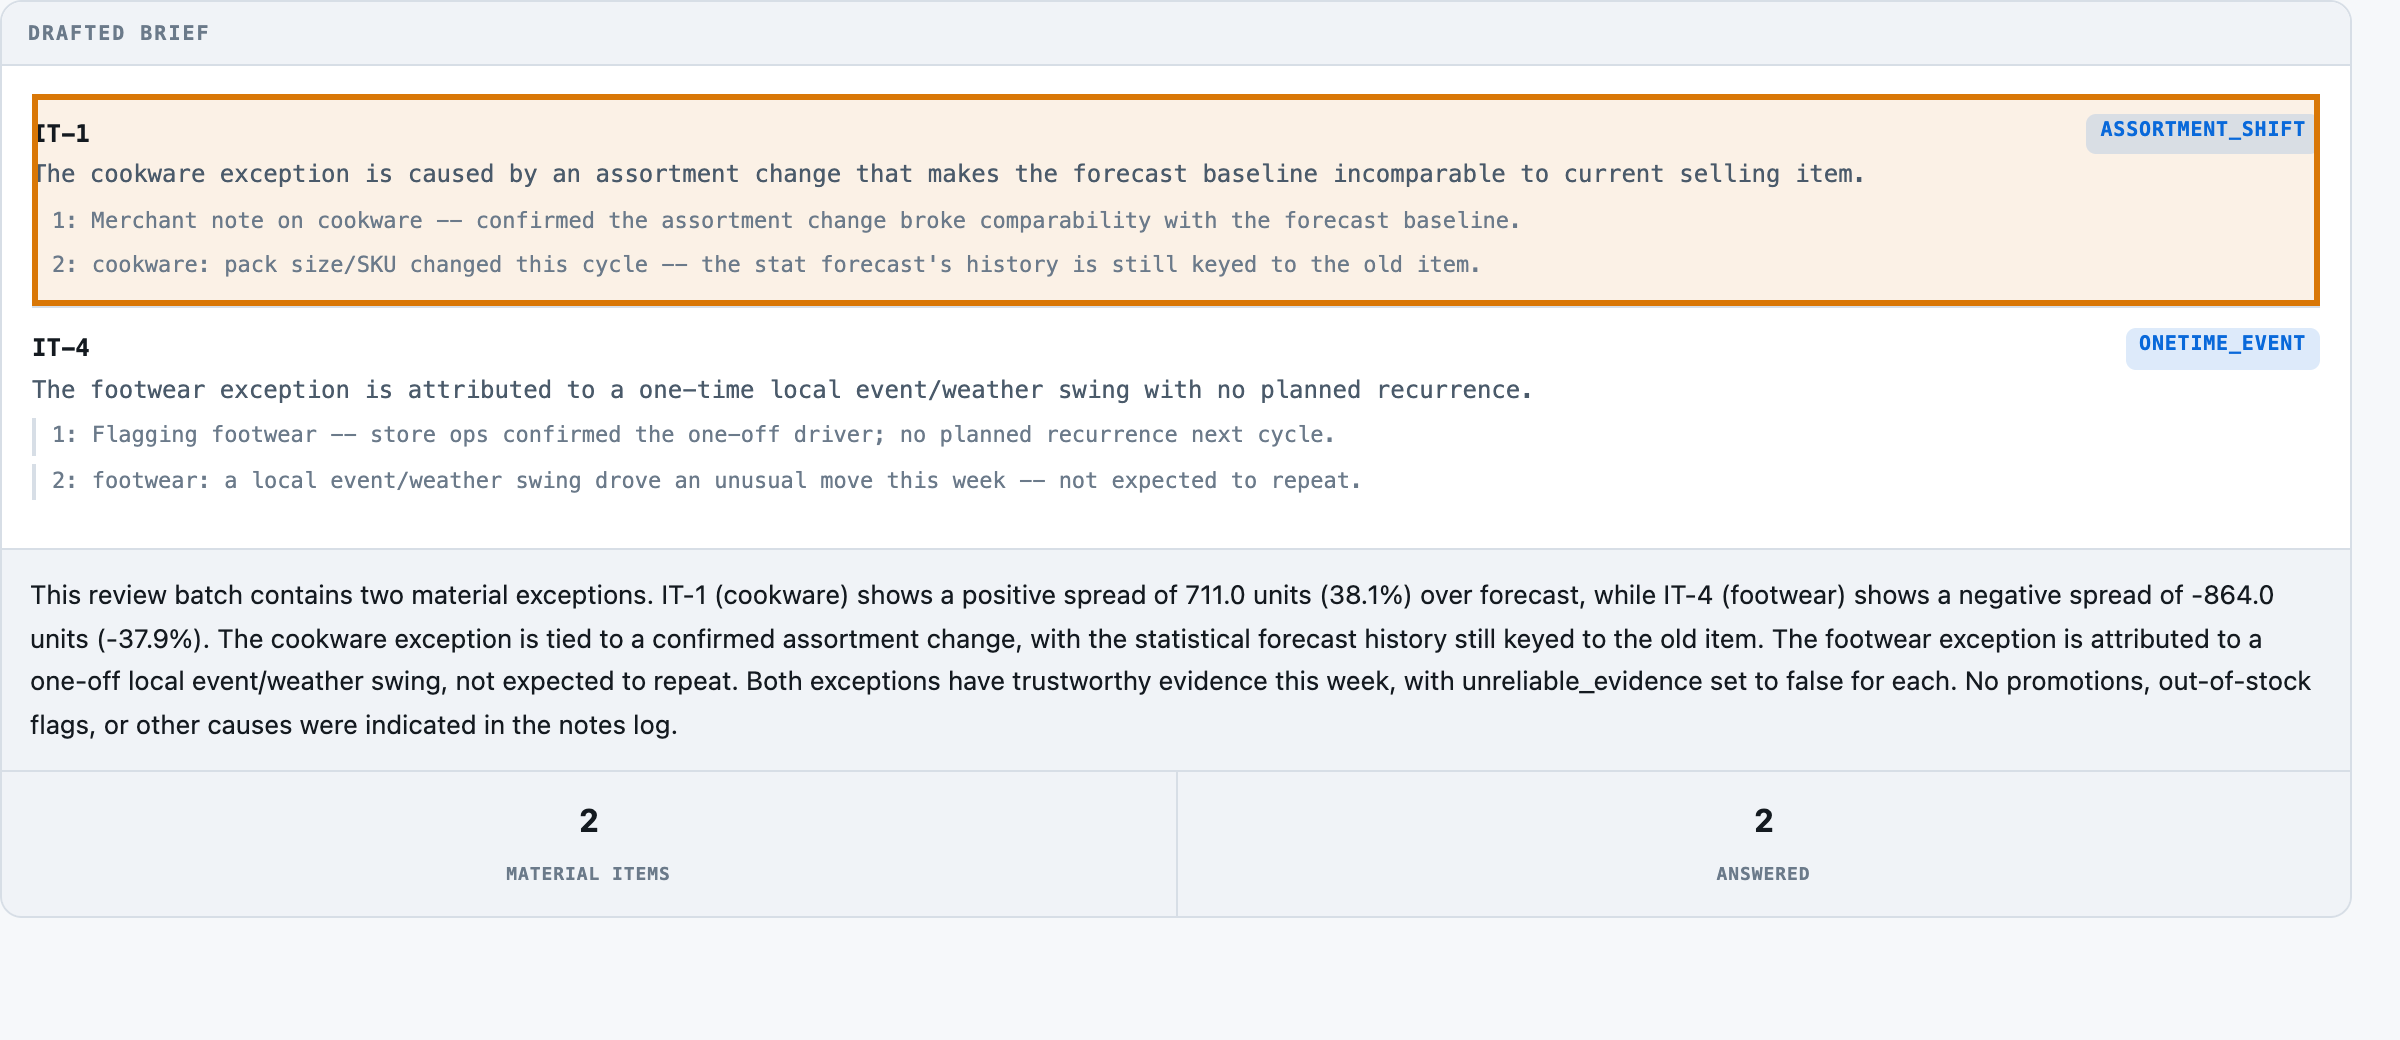
4The cause it names Assortment shift, with both cited notes as its evidence.
5The narrative it drafts The review narrative, written from the same two notes, for the meeting.
For engineers
How it is built, and how we measured it
All fourteen steps of the build are written up, from the business case to running it in your own environment.
A small, forkable project that does one job end to end. Run once for real, and every figure on these pages captured from that run.
PresenterOpens the private repo. Visible to admins only.
The business caseThe problem this solves
An automated statistical forecast throws an exception queue -- item/location combinations where recent POS disagrees with the baseline by enough to matter -- and someone has to assemble the supporting evidence before a demand planner can decide whether to touch the forecast. Doing that by hand means pulling recent POS, lost-sales/OOS flags, the promo calendar and the prior-year analog for each flagged item, then reading the merchant notes log to work out why, before the review meeting even starts. A demand planner opening the forecast-exception queue, pulling recent POS, lost-sales/OOS flags, the promo calendar and the prior-year analog for each flagged item by hand, then reading the merchant notes log to work out why -- before anyone can even discuss whether to touch the statistical forecast.
Audience
Whoever runs a statistical-forecast exception review meeting, and the demand planners who prep the evidence packet beforehand. Every number on these pages came from one real run of this code, not from a vendor page.
The inputThe actual review batches
The corpus is 40 review batches, 0.08 MB (jsonl 2). A retail demand-forecast exception queue is the scenario the kit's originating use case names, and it exercises every evidence signal the atlas row's own description lists -- recent POS, lost-sales/OOS flags, the promo calendar, the prior-year analog -- against a synthetic corpus that ships under this repository's own MIT licence, because no real one could.
The corpus
The 40 review batchesgenerated from a fixed seed, so no real record, person or institution appears in it.
Where each came fromwritten for this kit rather than collected — the corpus is generated in the kit's own repository, so there is no third-party data in it.
Swap this folder for your own material and the kit is pointed at your review batches. That is the whole change — there is no database to migrate.
One review batche, as the model receives itbatches.jsonl · 1 of 40
An itemized list of every material exception, each with a probable cause traced to two source lines -- or an honest 'unknown' -- and a short narrative for the meeting. Decision-free by design: nothing here recommends accepting or overriding the statistical forecast.
And when it cannot
A whole batch's exceptions go unanswered when the model's JSON reply is malformed (5 of 139 material exceptions this run, all from one batch), or an item's id is echoed in a non-schema format that breaks a downstream join (6 of 139 on the reasoning tier). Both traced this run to output-formatting slips, not a missed read of the evidence. See not_good_enough.
Where it fitsWhat did work
Every line below is a measured result from this kit's own runs, with the figure that supports it. The headline above is not softened by any of them.
An exception with two clear, item-labelled notes lines explaining it — the fast tier 100% cause-tag agreement on every traceable exception this run measured, with zero fabricated citations.
An exception the notes log genuinely does not explain — the fast tier It said 'unknown' correctly on all 48 gold-unknown exceptions this run measured, rather than reaching for the nearest plausible-sounding line.
Feeding the brief's output straight into a system that keys on item_id — add a schema-validation pass before trusting the id field 3 of 40 reasoning-tier batches (6 items) returned an item_id with the label and location appended, which broke an exact-match join even though the cause and citations for those same items may have been reasonable -- this run's scorer never got to check.
A batch with far more flagged items or notes chatter than this corpus plants — not measured here src/pack.py's 20-item / 40-line caps were never exercised -- every batch in this corpus ships at most 5 items and 6-11 notes lines.
At a glanceHow the whole thing runs
96%exception completeness recall pct
3,865 msp50, end to end
$0.33per 1,000 review batches · Google Gemini 2.5 Flash-Lite
Run once, for real, on 2026-08-18. Every figure on these pages was captured from that run — nothing is written from intent.
14 steps, grouped by the question that sends you to them rather than by build order. Each tile carries the one figure that step is about, and opens the page behind it.
Explain why store sales broke from the forecast14 steps · 4 questions · run once, for real · 2026-08-18
Every tile is a linkall 14 steps · no step without a page
Should you use this?What you bring, where it stops, and when not to use it
Before you commit an afternoon to this, these are the answers that decide it. Each one is rendered from the record it lives in — and links the page that holds it in full.
What do I have to bring?
Point tools/build_corpus.py at your own forecast/actuals feed and your own flagged item/location candidates -- a reorder-point exception, a staffing-plan exception, anything an automated statistical baseline flags against an actuals feed -- and src/segment.py, src/pack.py and src/prompt.py do not change. The measured recall, cause-tag agreement and cost figures on this page are specific to this corpus's evidence shape (five signals per item, 6-11 notes lines per batch) and its own MATERIALITY_PCT threshold.Corpus lens →
When is this the wrong choice?
Avoid: Nothing measured against this run breaks the case -- it is the one the model handles cleanly on both tiers. That is the case against the best-fitting scenario (“An exception with two clear, item-labelled notes lines explaining it”). 4 scenarios scored in all, each with its own.Eval lens →
Where does it stop working?
A cause outside the five-member vocabulary -- a real exception-review meeting will eventually name a cause this kit's fixed list does not carry. 4 recorded failure modes, each from a run rather than a guess.Corpus lens →
What was never verified?
Whether the fast tier's 1-of-40 malformed-JSON reply and the reasoning tier's 3-of-40 item_id-formatting slip are stable properties of either model at these settings, or one-off -- one recorded run per tier is not a history. 4 items this kit says it could not check.Eval lens →
Can I run this on a model I control?
Yes — any OpenAI-compatible endpoint, including one on your own hardware. The shipped adapter takes its host from BASE_URL and its model from MODEL, so nothing in src/ changes. The published figures come from 2 models on the fast tier and the reasoning tier, one provider, one key. Prompt lens →
And if it fits — what do I stand up?
4 artifacts with a stated home and a stated egress, and 3 decisions each with what you provision past its ceiling — plus what was not measured. That is the next page, not this one.step 14 — Run it in your environment →
Not asked of this kit — 2 questions: clone (a fresh clone of this kit runs with nothing fetched); judge (nothing here is graded by a model).
Last verified 2026-08-18 — r001-exception-brief. Every figure on these pages was captured from that run.
Run itHow this reaches your data
Every result on this page was produced by pure code over checked-in files, with no API key — which is why you can read the numbers before anyone spends anything.
Run this on your own data
The pipeline, its eval harness and the runs behind every numberdeployed inside your environment, on your own model endpoints, against your own documents.
The corpus above is the shape, not the limitit is a folder swap, and there is no database to migrate.
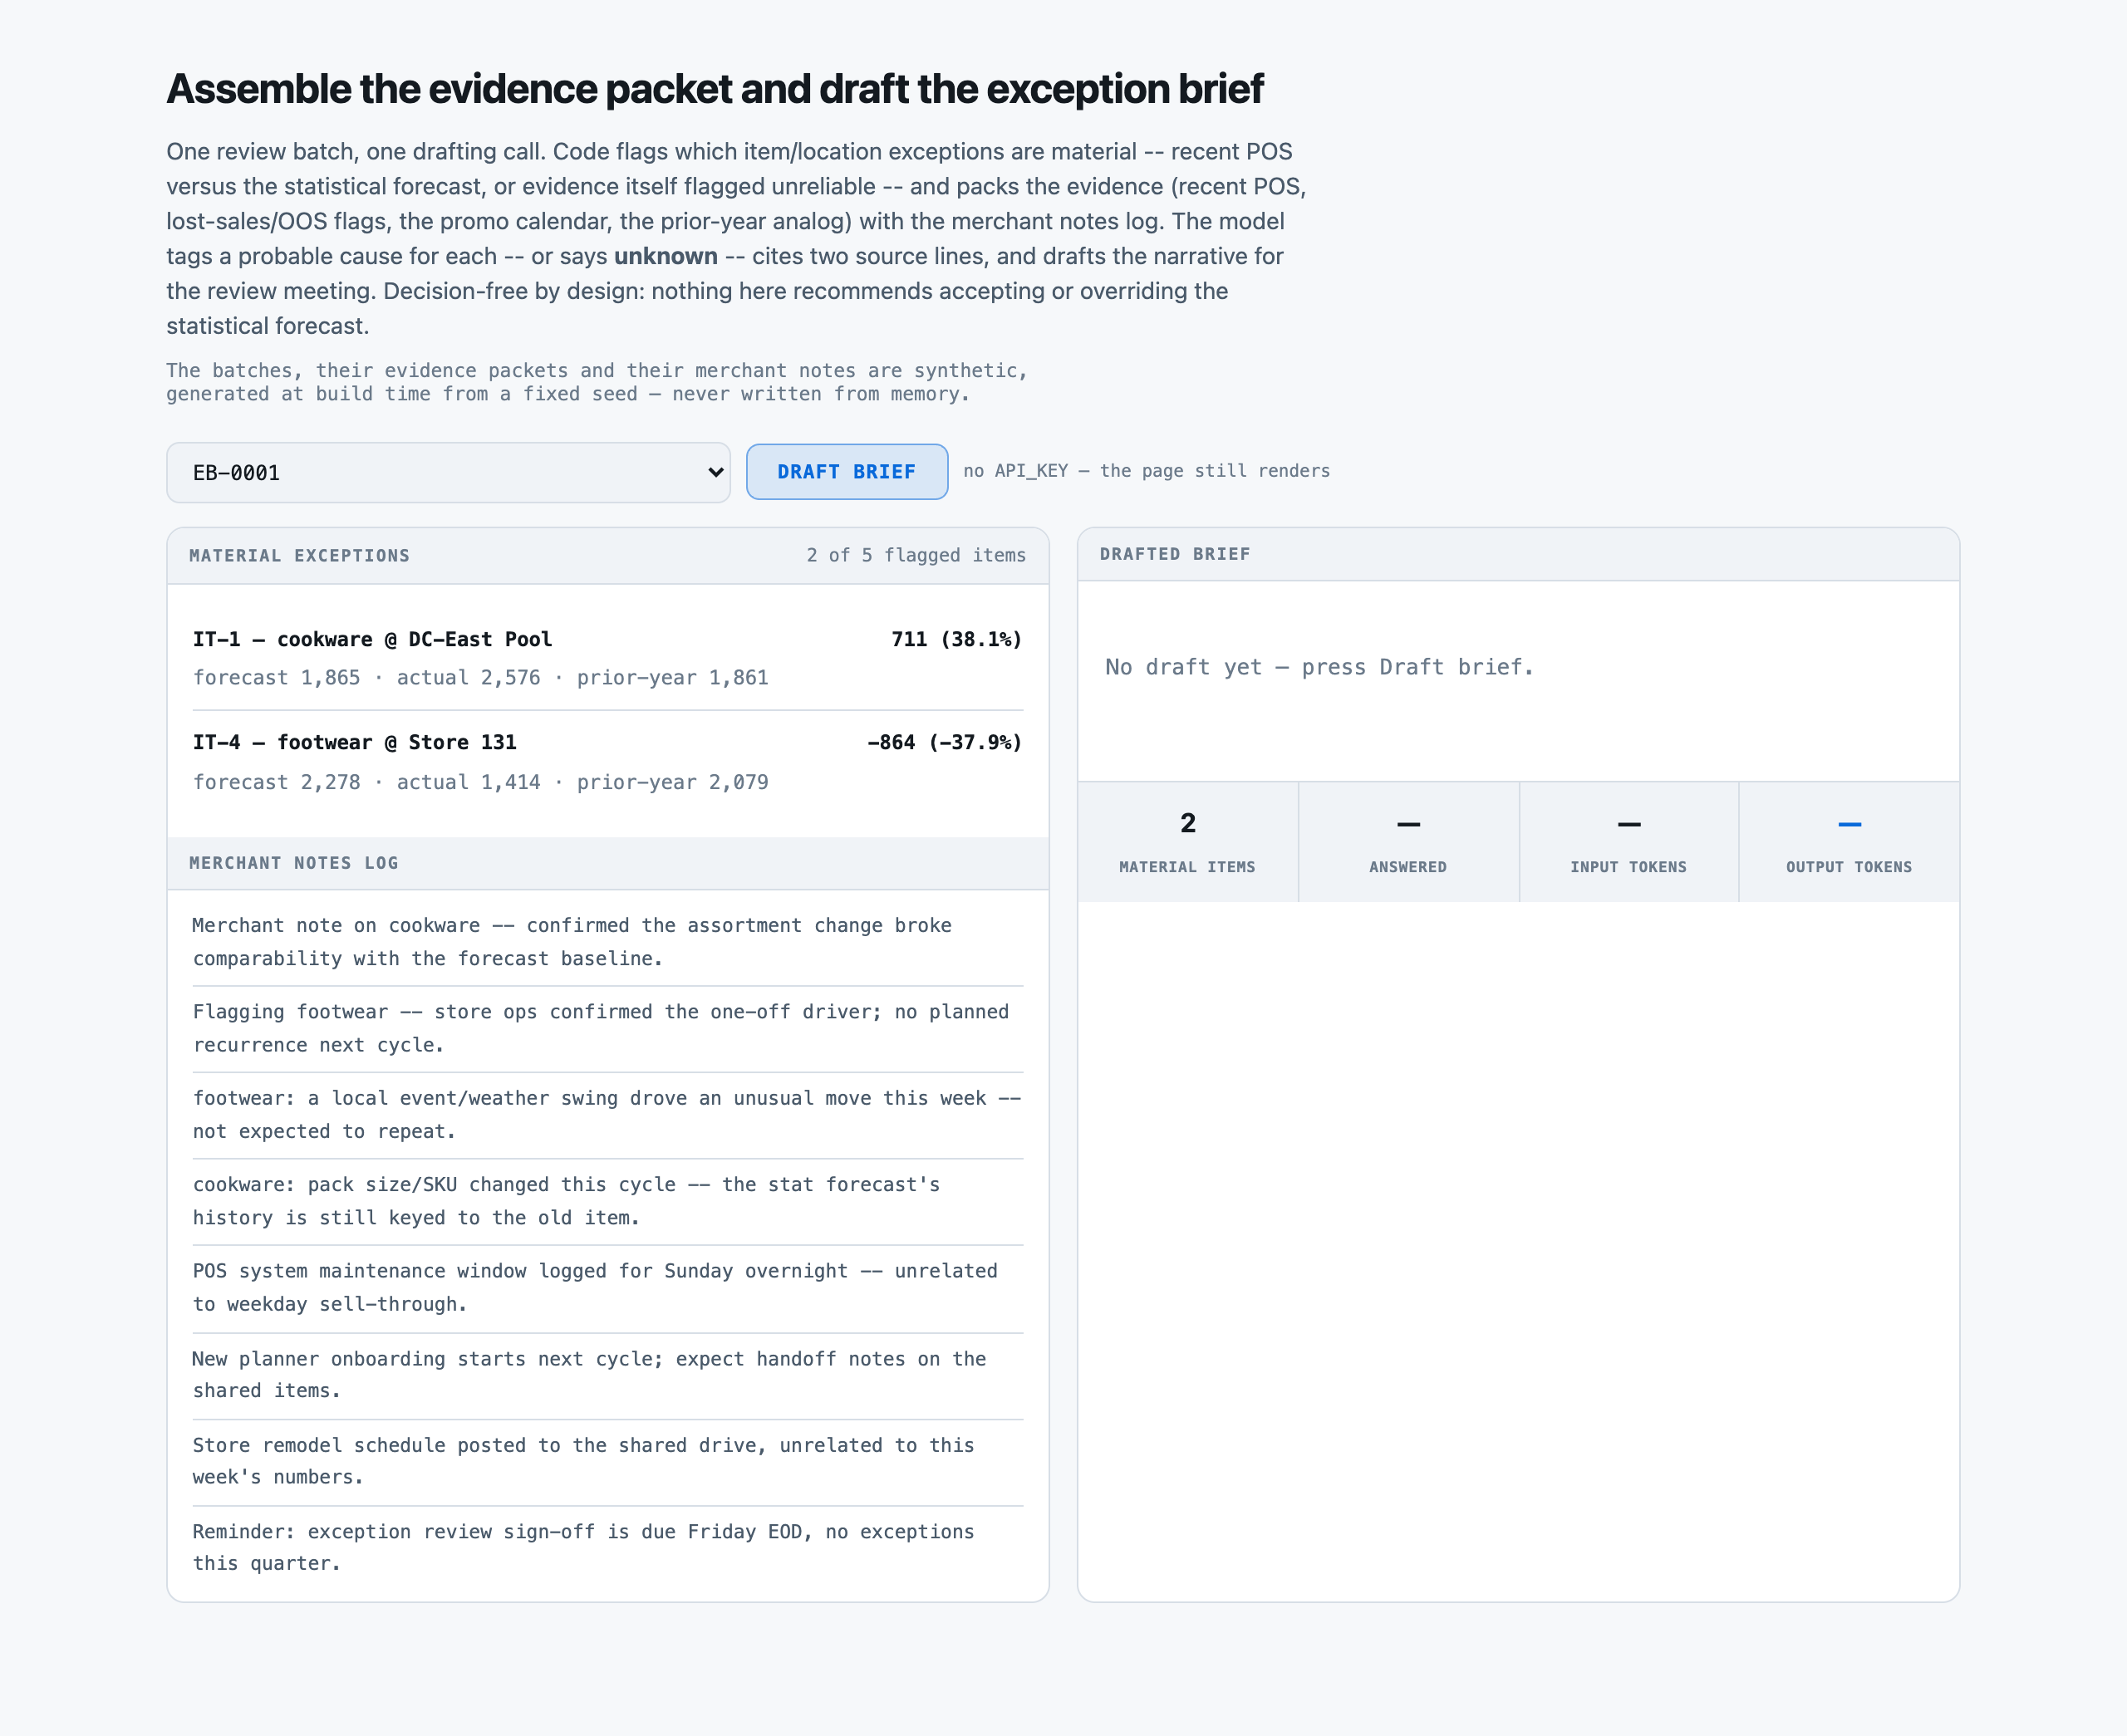
Checked before this shipped — A fresh clone with no API_KEY renders the full material-exception panel and merchant notes log for all 40 batches -- /api/state and /api/batch need nothing. Pressing Draft brief returns a calm 200 explaining nothing was called, rather than an error (see UI.shots).
PresenterOpens the private repo. Visible to admins only.
Step 01 of 14Business case
Written for: product manager · Measured during the eval run. Never estimated, never quoted from a vendor page.
In brief
96.4%rows answered
3,865 msp50, end to end
4,723 msp95
2 minclone to first result
What the clock covers. END-TO-END per review batch: one HTTP request carrying every material exception plus the batch's merchant notes log, and the reply parsed to a per-item cause/citation list plus a narrative. Flagging which items are material and assembling the evidence packet happen before this clock starts and cost no network at all -- pure code over the batch's own JSON.
Current processWhat it replaces
A demand planner opening the forecast-exception queue, pulling recent POS, lost-sales/OOS flags, the promo calendar and the prior-year analog for each flagged item by hand, then reading the merchant notes log to work out why -- before anyone can even discuss whether to touch the statistical forecast.
Where it is not good enough
The fast tier's entire recall gap traces to one malformed-JSON reply, never to a judgement error. In 1 of 40 batches (EB-0040) the reply's narrative string was never closed with a quote before the final brace -- finish_reason 'stop' and only 697 of a 2,200-token ceiling used, so this was not a budget cutoff -- which zeroed that batch's five material exceptions outright (0 of 5 answered). Wherever a reply parsed (39 of 40 batches), cause-tag agreement, citation fidelity and narrative faithfulness were all 100%: this run's only weakness is output-format discipline, not reasoning. The reasoning tier does not fix this -- it trades one failure mode for another: it parsed every batch (no malformed JSON), but on 3 of 40 batches (EB-0011, EB-0023, EB-0032) it echoed item_id with the label and location appended -- "IT-1 (pet-supplies @ Store 122)" instead of the schema's bare "IT-1" -- which fails an exact-match join for both items in each of those batches at once, at roughly 3.2x the fast tier's cost and nearly double its latency. See Cost.cost_by_model.
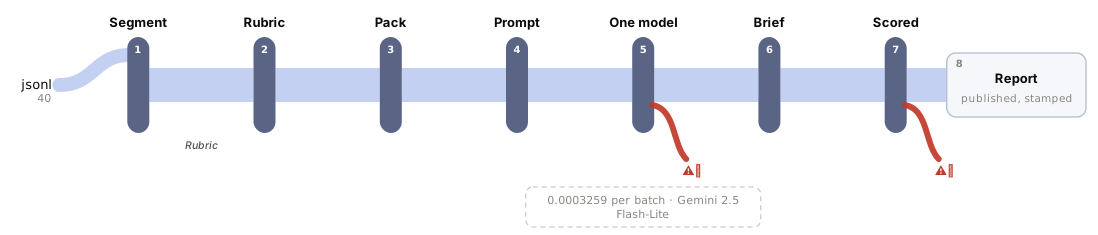
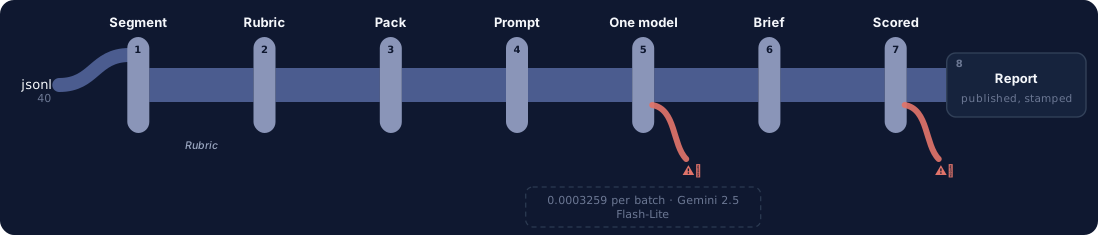
One question, end to end. Colour on the fan-in is the corpus format; a red hook marks every station with a recorded failure, and the words — every sub line, failure and report field — are in the ledger beneath. Every station is a link — click one to jump to its row, and each row links to the lens that explains it.
the always-unknown floor scores 100 pct completeness and 35.3 pct cause-tag agreement at $0.00 (it never claims a specific cause); the fast-tier model reaches 96.4 pct completeness and 100 pct cause-tag agreement at $0.0003259 a batch but is not clean either — every miss traces to one batch's malformed-JSON reply, not a wrong judgement. The reasoning tier costs roughly 3.2x more and trades that failure for a different one — an item_id-formatting slip on 3 of 40 batches — landing at 95.7 pct completeness and precision.
The swap seams
Seam
File
What changes
the model
src/adapters/__init__.py
.env plus the same run again. Any OpenAI-compatible provider or Anthropic.
the corpus
tools/build_corpus.py
Point it at your own forecast/actuals feed and your own flagged candidates -- a reorder-point exception, a staffing-plan exception, anything an automated baseline flags against an actuals feed. src/segment.py, src/pack.py and src/prompt.py do not change.
the materiality threshold
src/segment.py
MATERIALITY_PCT is a module-level constant read once at import time -- change the percentage, or add a second gate, without touching the prompt.
the cause vocabulary
src/rubric.py
CAUSE_VOCAB and CAUSE_MEANINGS are the single source the prompt, the app and the scorer all import -- add a sixth cause here plus template notes in tools/build_corpus.py, not in the prompt text directly.
Components
Component
File
Role
corpus generator
tools/build_corpus.py
Generates 40 review batches, 200 flagged item/location candidates across five categories each, a merchant-notes log per batch and the gold exception list, from a fixed seed. Seven scenarios are planted, each with a KNOWN true cause (or none, on purpose) -- see data/SOURCES.md.
the cut
src/segment.py
SEAM -- flags which item/location candidates are material (recent POS vs. the statistical forecast beyond a stated threshold, or evidence itself flagged unreliable). Pure code, no model. The SAME threshold the generator was sized against, imported by both -- see src/segment.py's own header.
the rubric
src/rubric.py
The five-member cause vocabulary and the three graded axes (completeness, cause-tag agreement, narrative faithfulness), declared once and imported by the prompt, the app and the scorer so they can never silently drift apart.
Pack
src/pack.py
Deterministic assembly of one batch's material-only exception list and its notes log into the context the model sees, capped to a stated budget. Pure code -- a clean item never reaches the model.
the prompt
src/prompt.py
The cause vocabulary, the per-item answer schema and the narrative instruction, declared once and read from here by the prompt, the parser and the app.
the model adapter
src/adapters/__init__.py
SEAM -- the model. Raw HTTP for every provider, stdlib only.
the AI layer
src/brief.py
Loads one batch, flags and packs its material exceptions, calls the model once, parses the reply. The whole AI layer, deliberately short.
the app
src/app.py
Static files and a handful of JSON endpoints on the standard library. Runs the same citation-fidelity check evals/scoring.py runs, on every live draft, before the UI renders it -- not only after the fact in a committed eval result.
Where it breaks at scale
src/pack.py caps a batch at 20 items and 40 notes lines, both far above what this corpus ever exercises (at most 5 items, 6-11 notes lines per batch). A real exception queue reviewed weekly per region could plausibly flag far more than 5 items at once; nothing here has measured cause-tag agreement or citation fidelity against a longer notes log or a larger single-call item count. src/brief.py also calls the model unconditionally, with no early-return when a batch's packed item list is empty: EB-0013 (0 of 5 items material) still cost a real call, 903 input tokens spent confirming nothing needed review -- so cost does not cleanly track exception volume the way a smarter pipeline would make it. At scale, a region with mostly-clean weeks pays a small but real per-batch floor for a call that answers nothing.
PresenterOpens the private repo. Visible to admins only.
Step 03 of 14App UI
Written for: anyone, in 5 seconds · Screenshots of the running app taken during the run.
SuccessesWhen it works
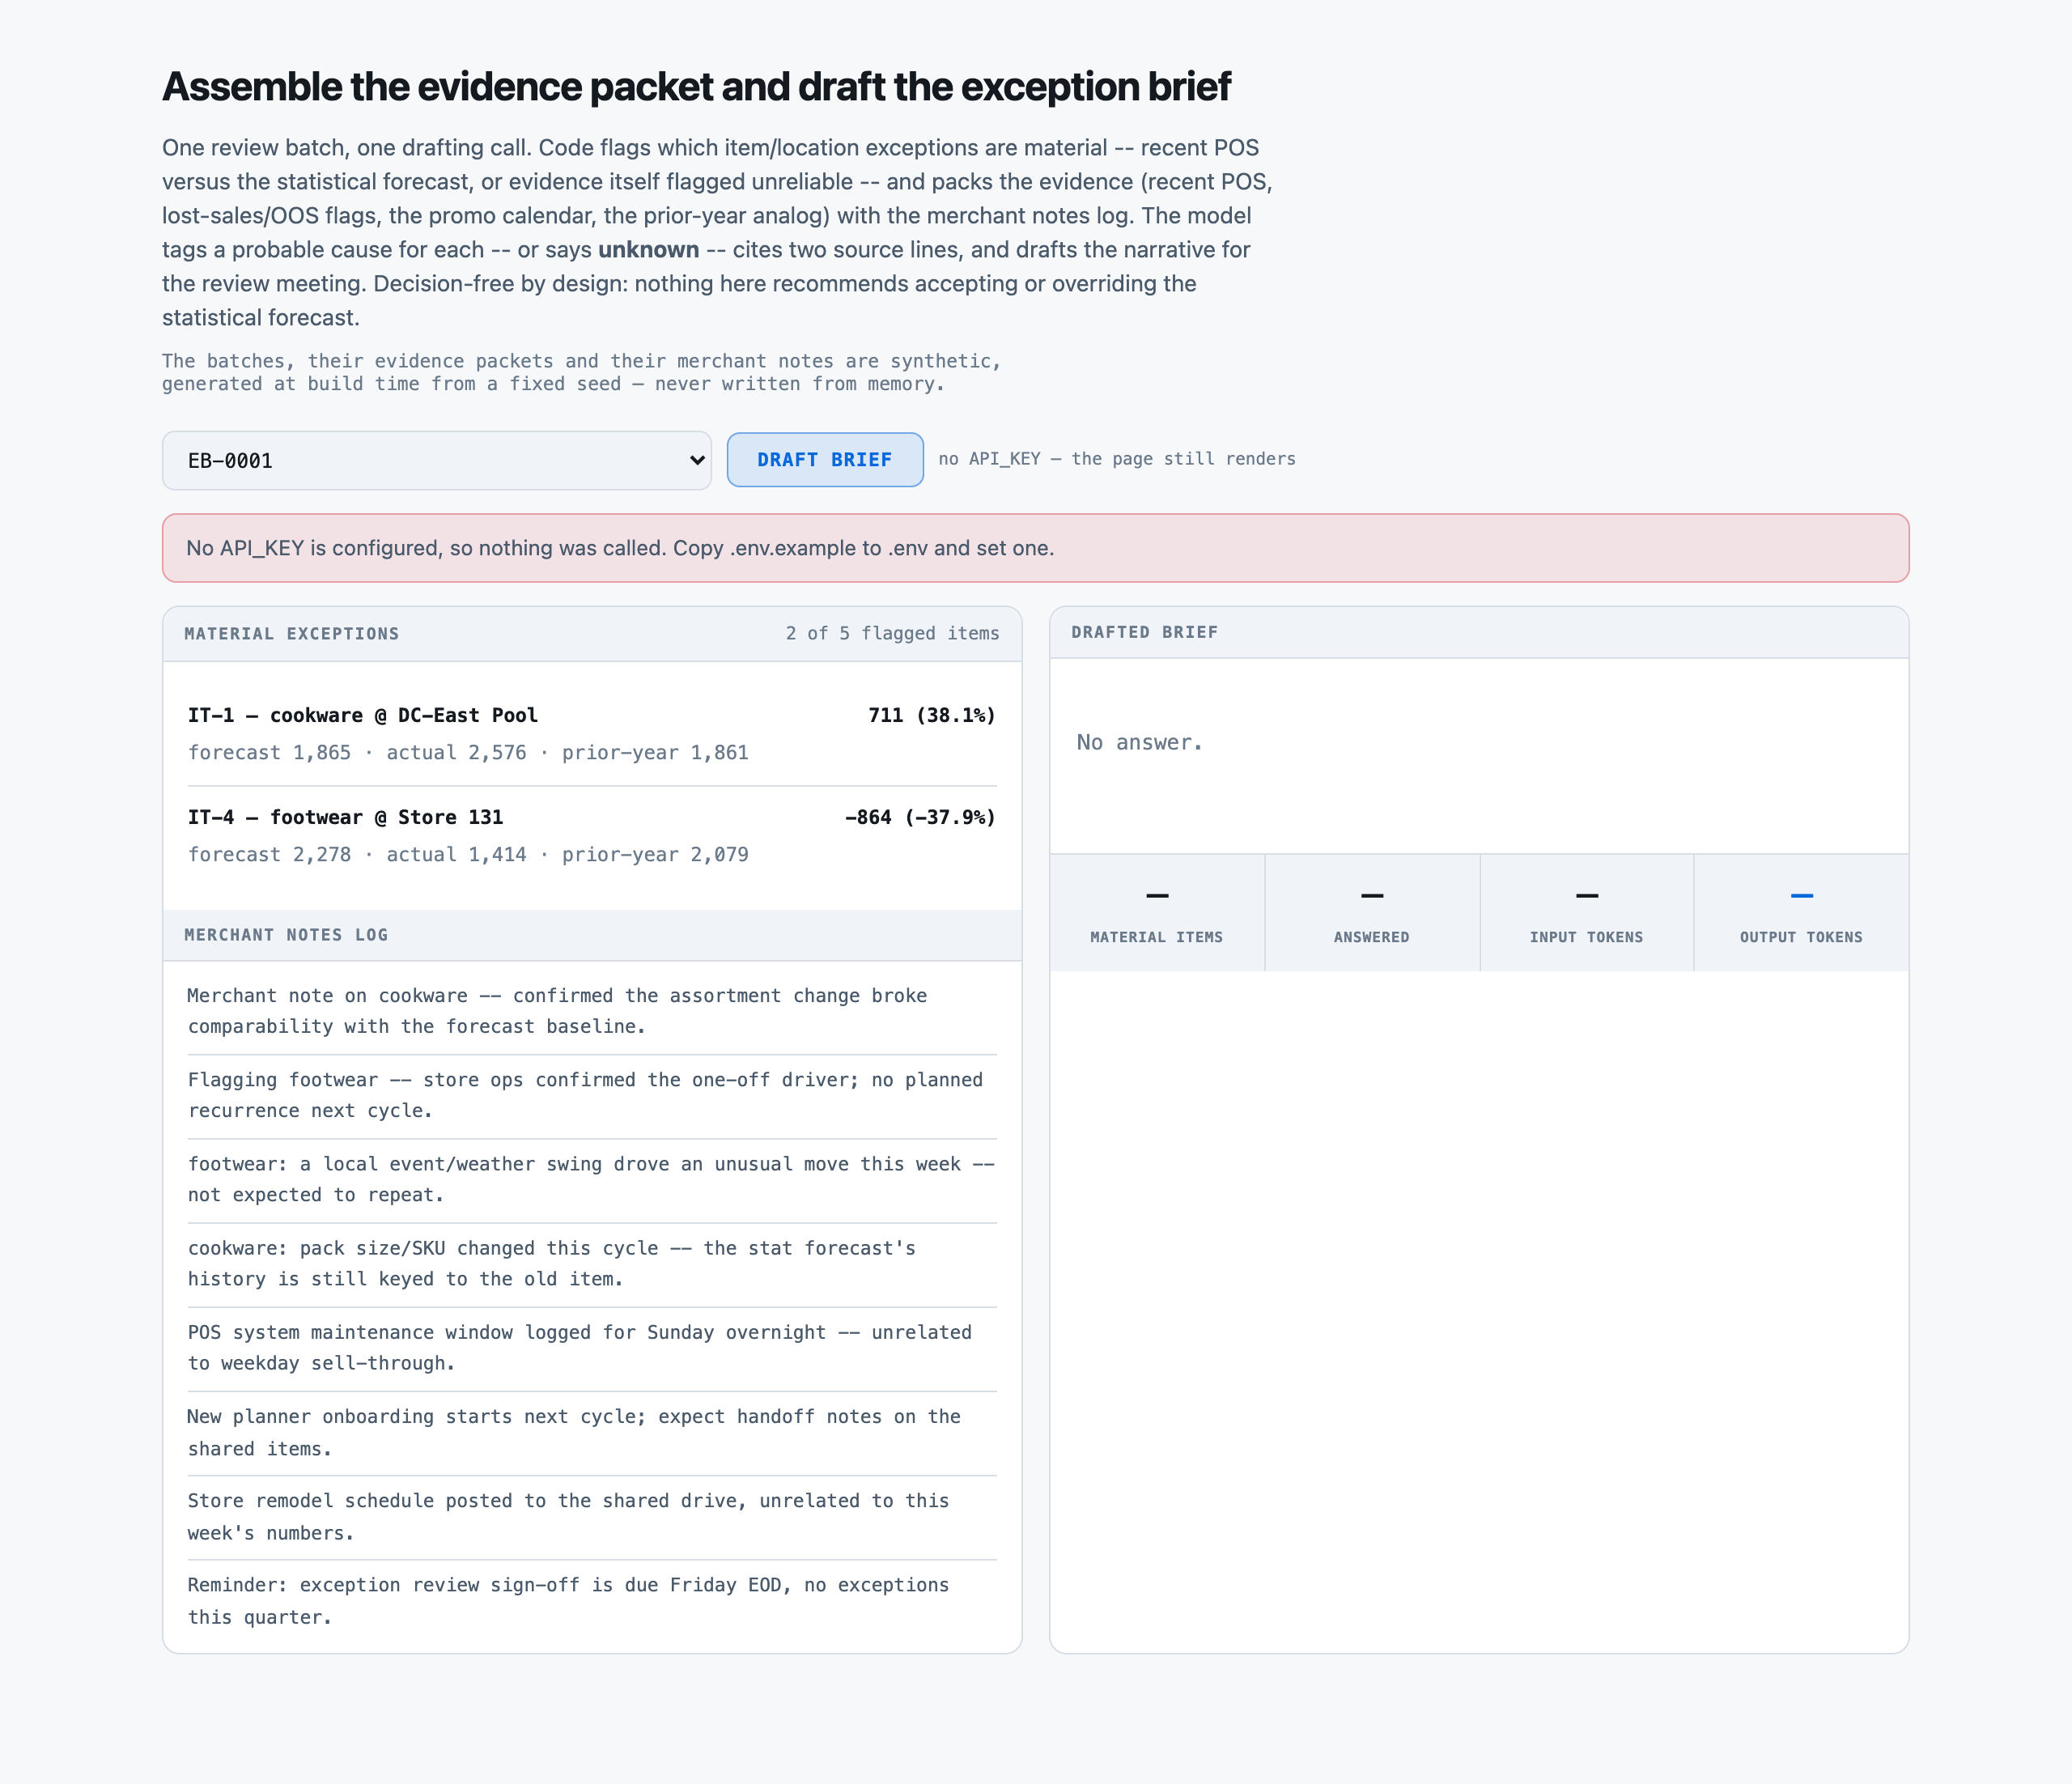
Batch EB-0001, Midwest 2026-W05: two material exceptions shown against their forecast, actual POS and prior-year analog, alongside the batch's own merchant notes log, before any call is made.successOpen full size →
LimitsWhen it does not
A report showing only wins is an advert. This one is required, and the validator now refuses a kit that omits it.
The same page after pressing Draft brief with no API_KEY configured: a calm 200 explaining nothing was called, rather than an error. No draft is shown -- this is the honest failure state, not a staged one.failureOpen full size →
PresenterOpens the private repo. Visible to admins only.
Step 04 of 14Corpus
Written for: "can I point this at mine?" · Measured off the corpus the run actually used.
In brief
40review batches
0.08 MiBjsonl 2
p50 4chars per material exception
$0.00setup · 0.0s
How it is cutWhat one material exception is
One review batch, cut to its material-only exception list by src/segment.py::material_exceptions -- no train/test split, every batch is drafted once.
SetupWhat the setup figure measured
There is no index. 0.04s is tools/build_corpus.py generating 40 batches, 200 flagged item/location candidates and their notes from a fixed seed, with no clock read and no model called.
LicenceLicence
MIT -- this repository's own licence
Bring your ownBring your own review batches
Point tools/build_corpus.py at your own forecast/actuals feed and your own flagged item/location candidates -- a reorder-point exception, a staffing-plan exception, anything an automated statistical baseline flags against an actuals feed -- and src/segment.py, src/pack.py and src/prompt.py do not change.
⚠︎ And what stops being true when you do: The measured recall, cause-tag agreement and cost figures on this page are specific to this corpus's evidence shape (five signals per item, 6-11 notes lines per batch) and its own MATERIALITY_PCT threshold. A real exception queue's notes volume, evidence completeness and materiality threshold will differ and change every headline number -- re-run the eval against your own corpus before trusting these figures on it.
What breaks it
A cause outside the five-member vocabulary -- a real exception-review meeting will eventually name a cause this kit's fixed list does not carry.
Two compounding causes on one exception, or two items in the same batch sharing a root cause -- this corpus always plants exactly one cause per item (or none).
A notes log at real deployment volume -- this corpus ships 6-11 lines per batch; src/pack.py's 40-line cap was never exercised.
A model reply whose item_id carries anything beyond the bare schema value -- an exact-match join breaks on the appended-label format the reasoning tier produced on 3 of 40 batches this run.
PresenterOpens the private repo. Visible to admins only.
Step 05 of 14Prompt
Written for: engineer · Logged from the run, verbatim.
In brief
The assembled prompt in full, and its real decomposition. Every part below occurs in the prompt that was actually sent, and the token counts sum to the recorded input total — but they are the input total apportioned by each part’s share of the characters, not a per-part reading from the provider’s counter. The total is measured; the split is arithmetic, and a part carrying denser text really costs more of it than this says.
AssemblyHow the prompt is assembled
Part
Characters
Tokens
system
3,336
836
items
1,066
267
notes
1,188
298
Total
1,401
This is the cost lesson as arithmetic: of the 1,401 tokens assembled, 836 are instructions — 60% of the prompt, the largest single part. A per-request bill follows whichever part is biggest, and on this kit that is the one named here.
Logged verbatim by evals/run.py on r001-exception-brief -- the literal user message sent for batch EB-0004, with the fixed system prompt from src/prompt.py prepended.
Full promptThe prompt in full
The verbatim prompt, as sent
the prompt, as sent
You are assembling the exception review packet for a statistical demand-forecast review meeting. You are given one review batch's MATERIAL exceptions -- item/location combinations where recent POS disagrees with the statistical forecast by enough to matter, or whose recent POS is flagged unreliable, already identified by code -- and that batch's own merchant notes log.

For EACH exception in the list, decide which of these five causes applies, using ONLY the notes log and the evidence fields already on the item -- never outside knowledge, never a plausible-sounding guess:

  promo_uncaptured     a promotion on the calendar for this item/location was locked in after the statistical forecast was generated (or is otherwise not baked into the baseline), and the lift or drag it caused is what the recent POS shows.
  oos_suppressed       an out-of-stock or lost-sales period this week means recent POS understates -- or a stock-clearing rebound overstates -- true demand for this item/location.
  onetime_event        a one-off, non-repeating driver (weather, a local event) moved this item's recent POS away from the statistical baseline, with no reason to expect it to recur next cycle.
  assortment_shift     the item, pack size or channel changed recently enough that the statistical forecast's history is no longer a fair comparison to what is selling now.
  unknown              the evidence packet does not support any of the four causes above for this specific item/location. This is the correct answer when the evidence is not there -- guessing a specific cause is a worse answer than saying so.

If the notes log supports a specific cause for that item, name it and cite the exact two notes lines (verbatim) that together support it. If the notes log does NOT support a specific cause for that item -- no line mentions it, or the lines that do mention it don't add up to one of the four named causes -- the cause is 'unknown' and the two citation fields must be empty strings. Do not cite a line that does not actually name or clearly concern that item just because it is the closest-sounding one available: an unsupported 'unknown' is the correct, honest answer and is graded as such; a cause with a citation that is not really about that item is graded as a fabrication, which is worse.

Each exception also carries an unreliable_evidence field in the input, set to true when this item/location's recent POS could not be trusted this week (a data or register outage), or false when the actual figure is trustworthy. Echo that exact state back in your answer for that item.

After the per-item entries, write a short narrative (3-6 sentences) for the review-meeting audience that ties the material exceptions together. Every number you state in the narrative -- a unit figure, a percentage, a count of exceptions -- must be a number that is actually present in the exception list you were given; do not compute, round, or restate a figure that changes its value.

NEVER recommend whether to accept or override the statistical forecast, and never rank or suggest an action to take. That decision belongs to the demand planner in the meeting this packet is for -- your job is limited to itemizing, tagging a probable cause (or saying unknown), and describing what the exceptions are, never what should be done about them.

Batch EB-0004 -- Midwest, 2026-W12

MATERIAL EXCEPTIONS (5)
------------------------
- IT-1 (footwear @ DC-West Pool): forecast=1902.0 | actual=2414.0 | prior_year_analog=2011.0 | spread 512.0 (26.9%) | lost_sales_oos_flag=False | promo_flag=True | unreliable_evidence=False
- IT-2 (seasonal-decor @ Store 118): forecast=1763.0 | recent POS unreliable this week | prior_year_analog=1977.0 | spread None (n/a%) | lost_sales_oos_flag=False | promo_flag=False | unreliable_evidence=True
- IT-3 (snacks @ Store 131): forecast=1703.0 | recent POS unreliable this week | prior_year_analog=1857.0 | spread None (n/a%) | lost_sales_oos_flag=False | promo_flag=False | unreliable_evidence=True
- IT-4 (apparel-basics @ Store 104): forecast=1296.0 | actual=726.0 | prior_year_analog=1171.0 | spread -570.0 (-44.0%) | lost_sales_oos_flag=False | promo_flag=False | unreliable_evidence=False
- IT-5 (cookware @ Store 122): forecast=971.0 | actual=670.0 | prior_year_analog=947.0 | spread -301.0 (-31.0%) | lost_sales_oos_flag=False | promo_flag=False | unreliable_evidence=False

MERCHANT NOTES LOG
-------------------
- apparel-basics: pack size/SKU changed this cycle -- the stat forecast's history is still keyed to the old item.
- footwear: a promo/ad placement was locked in after the statistical forecast was generated -- the baseline never saw it.
- Flagging cookware -- store ops confirmed the one-off driver; no planned recurrence next cycle.
- New planner onboarding starts next cycle; expect handoff notes on the shared items.
- Merchant note on apparel-basics -- confirmed the assortment change broke comparability with the forecast baseline.
- cookware: a local event/weather swing drove an unusual move this week -- not expected to repeat.
- POS system maintenance window logged for Sunday overnight -- unrelated to weekday sell-through.
- Reminder: exception review sign-off is due Friday EOD, no exceptions this quarter.
- IT ticket open for the reporting tool's export button; workaround is CSV download.
- Follow-up on footwear -- confirmed the promo calendar entry posted late this cycle; expect POS to keep running up of the stat forecast while it's live.
- Vendor scorecard refresh landed in the shared drive, unrelated to this cycle's exceptions.

Return a JSON object with two keys: "items", a list with exactly 5 entries, one per exception above in the same order, each {"item_id": <id>, "cause": <one of: promo_uncaptured, oos_suppressed, onetime_event, assortment_shift, unknown>, "citation_1": <verbatim notes line, or "">, "citation_2": <verbatim notes line, or "">, "unreliable_evidence": <true or false>, "note": <one sentence>}; and "narrative", a string of 3-6 sentences.
Answer with the JSON object only.
Raw responseThe raw response
The raw response, before any parsing
the response, unparsed
{
  "items": [
    {
      "item_id": "IT-1",
      "cause": "promo_uncaptured",
      "citation_1": "footwear: a promo/ad placement was locked in after the statistical forecast was generated -- the baseline never saw it.",
      "citation_2": "Follow-up on footwear -- confirmed the promo calendar entry posted late this cycle; expect POS to keep running up of the stat forecast while it's live.",
      "unreliable_evidence": false,
      "note": "Promo was locked in after forecast generation, explaining the higher actuals."
    },
    {
      "item_id": "IT-2",
      "cause": "unknown",
      "citation_1": "",
      "citation_2": "",
      "unreliable_evidence": true,
      "note": "No notes line mentions seasonal-decor or Store 118, and the POS is unreliable this week."
    },
    {
      "item_id": "IT-3",
      "cause": "unknown",
      "citation_1": "",
      "citation_2": "",
      "unreliable_evidence": true,
      "note": "No notes line mentions snacks or Store 131, and the POS is unreliable this week."
    },
    {
      "item_id": "IT-4",
      "cause": "assortment_shift",
      "citation_1": "apparel-basics: pack size/SKU changed this cycle -- the stat forecast's history is still keyed to the old item.",
      "citation_2": "Merchant note on apparel-basics -- confirmed the assortment change broke comparability with the forecast baseline.",
      "unreliable_evidence": false,
      "note": "Pack size/SKU change broke comparability with the forecast baseline."
    },
    {
      "item_id": "IT-5",
      "cause": "onetime_event",
      "citation_1": "Flagging cookware -- store ops confirmed the one-off driver; no planned recurrence next cycle.",
      "citation_2": "cookware: a local event/weather swing drove an unusual move this week -- not expected to repeat.",
      "unreliable_evidence": false,
      "note": "A one-off local event/weather swing drove the unusual move, not expected to repeat."
    }
  ],
  "narrative": "This batch contains five material exceptions. IT-1 footwear shows a 26.9% spread with a late-locked promo driving POS above forecast, while IT-4 apparel-basics and IT-5 cookware both show negative spreads (IT-4 at -44.0% and IT-5 at -31.0%) due to an assortment change and a one-off event respectively. IT-2 and IT-3 have unreliable POS data this week and no supporting notes, leaving their causes unknown. The unreliable_evidence flags for IT-2 and IT-3 are true. The remaining exceptions have reliable evidence and clear causal drivers from the notes log."
}
PresenterOpens the private repo. Visible to admins only.
Step 06 of 14Evals
Written for: the skeptic · The harness output, with as_of / model version / dataset version / verified_by.
In brief
Explain why store sales broke from the forecast — 40 review batches. Two tiers of one model family answered, and every answer was then graded one way — by == against a fixed gold value, which is a measurement too and only as good as the gold behind it.
The rulerHow it was graded
The grader is evals/scoring.py and it is pure code: the item set the brief covers is compared to the gold material-exception set (completeness), each matched item's cause is compared to gold (cause-tag agreement, split by whether gold's own cause was traceable or unknown), each non-unknown cause's two citations are checked as real, item-relevant substrings of that batch's own notes (fabrication), and every quantified claim in the narrative is checked against the packed evidence numbers (faithfulness). No judge model and no rubric scored by a person. The same module scores the app's live citation check.
40review batches
40source documents
2model tiers
80graded answers
1grading method
MeasurementsWhat was measured
COUNTED134 · 133 / 139exception completeness recall pct — material exceptionsDecided by == against a fixed gold value. No model graded this and it reproduces to the digit — which makes it checkable, not necessarily right: it is only as good as the gold behind it.
COUNTED134 · 133 / 134exception completeness precision pct — items the brief itemizedDecided by == against a fixed gold value. No model graded this and it reproduces to the digit — which makes it checkable, not necessarily right: it is only as good as the gold behind it.
COUNTED134 · 133 / 134cause tag agreement pct — matched itemsDecided by == against a fixed gold value. No model graded this and it reproduces to the digit — which makes it checkable, not necessarily right: it is only as good as the gold behind it.
COUNTED0 · 0 / 86fabricated cause — non-unknown matched itemsDecided by == against a fixed gold value. No model graded this and it reproduces to the digit — which makes it checkable, not necessarily right: it is only as good as the gold behind it.
COUNTED39 · 40 / 39narrative faithfulness pct — batches with a narrativeDecided by == against a fixed gold value. No model graded this and it reproduces to the digit — which makes it checkable, not necessarily right: it is only as good as the gold behind it.
NOT YET KNOWN—A person confirmed the gold is rightThe grader is == and needs no confirming. The gold does: it is machine-derived from the registry's structured modules, and every rate on this page rests on that derivation being faithful to what the prose actually says. Nobody has read a document against its gold record by hand.
Two words carry this page: Counted is deterministic and nobody's opinion and Not yet known is printed blank rather than filled with something plausible. There is no Judged row here and that is the point: nothing on this page is a model's opinion about another model. The row most worth having is currently the empty one.
How the method was validated
The method is pure comparison and cannot be wrong about itself; the risk is in the labels. Every gold cause and citation pair is decided by tools/build_corpus.py at generation time, before src/segment.py's materiality check ever runs on the same batch -- so a model's cause-tag agreement is a measured question, not a tautology.
501.0output tokens · the fast tier · 3,865 ms p50
549.125output tokens · the reasoning tier · 7,425 ms p50
Two tiers, one API key
Not two vendors and not a vendor comparison — which is the whole reason the two-model rule could be met without signing up to a second provider. Both tiers send the same retrieved context; the slower one writes about twice as much back, waits 1.9× as long, and lands one row apart on 40. This set does not separate them on quality and no ranking should be read from it — which is not an opinion about the models but something the second run below demonstrated.
Grading costWhat it costs
Every dollar on these pages is a MEASURED token count multiplied by a named vendor's PUBLISHED rate -- a projection onto a rate card, not a bill anyone paid.
Priced at
Per 1M in / out
One review batch
1,000 review batches
Share that is the prompt
Google Gemini 2.5 Flash-Lite the cheapest model Google publishes a rate for, and the card every kit in this series projects onto so the rows compare across use cases
$0.10 / $0.40
$0.000326
$0.33
39%
Amazon Nova Pro on Bedrock a frontier tier, for the other end of the range
$0.80 / $3.20
$0.002607
$2.61
39%
Same work, 8× the bill
The same review batches, the same tokens — only the rate card changed. And on either card about 39% of what you pay is the prompt this pipeline sends, not the answer it writes.
how many items in the batch clear MATERIALITY_PCT -- more material items means a longer evidence block and a longer expected answer list, and therefore more output tokens. ⚠︎ CORRECTED AFTER READING THE REAL RUN: this field previously claimed a batch with zero material exceptions makes no call at all. That is false -- src/brief.py calls the model unconditionally, and EB-0013 (0 of 5 items material) still cost a real call: 903 input tokens and 72 output tokens spent confirming there was nothing to review. See Architecture.breaks_at_scale.
Rates checked 2026-08-18. The provider that actually ran both scored evals is kept out of these tables per this estate's naming rule, so nothing here is what was actually paid -- the real spend for this kit's build (well under $0.06 across both tiers and the free baseline) is recorded in the commit history, not on this page.
The gradersOne way to grade, and why it is the only one
the fast tier 96.4% exception completeness recall · the reasoning tier 95.7% exception completeness recall · 2 more measured on each run
The row opens its own page: how the test was run, one real row, the formula with every iteration of it, and the analysis.
Why this set cannot separate them
Partial, and mostly about format, not judgement. Both tiers are expected to reach 100% cause-tag agreement on whatever they correctly itemize, because the task per item is small and the notes are short -- so the labelled set's real power is in catching format discipline (the malformed-JSON reply, the id-echo slip), which one run each cannot yet say is a stable property of either tier or a one-off. See Guardrails.bands.
Choosing oneWhen to reach for the model at all
The comparison is only useful if it ends in a choice, and on this kit the choice is not which grader — there is one, and it is ==. It is whether to call a model for this field at all, and the answer is conditional.
If your situation is
Use
Because
And avoid
An exception with two clear, item-labelled notes lines explaining it
the fast tier
100% cause-tag agreement on every traceable exception this run measured, with zero fabricated citations.
Nothing measured against this run breaks the case -- it is the one the model handles cleanly on both tiers.
An exception the notes log genuinely does not explain
the fast tier
It said 'unknown' correctly on all 48 gold-unknown exceptions this run measured, rather than reaching for the nearest plausible-sounding line.
Assuming a model will always resist guessing -- this corpus's notes are short (6-11 lines); a longer log was not measured.
Feeding the brief's output straight into a system that keys on item_id
add a schema-validation pass before trusting the id field
3 of 40 reasoning-tier batches (6 items) returned an item_id with the label and location appended, which broke an exact-match join even though the cause and citations for those same items may have been reasonable -- this run's scorer never got to check.
Trusting item_id as a clean key with no validation, on any run or either tier.
A batch with far more flagged items or notes chatter than this corpus plants
not measured here
src/pack.py's 20-item / 40-line caps were never exercised -- every batch in this corpus ships at most 5 items and 6-11 notes lines.
Assuming completeness and cause-tag agreement hold at a real deployment's exception volume without re-measuring.
This pipeline was also attacked, which is a different question from whether its answers are right: see Threat model for the injection experiment, its two gates and what it does not prove.
Failure causesHow it fails
Cause
What it means
Rows
A real example
correct_traceable_cause
Correctly itemized with the right traceable cause
86
EB-0004, IT-1 (footwear @ DC-West Pool): gold cause promo_uncaptured, model cause promo_uncaptured, both citations real and item-relevant -- see Eval.example_row.
correct_unknown
Correctly said 'unknown' rather than guessing
48
EB-0004, IT-2 (seasonal-decor @ Store 118): recent POS flagged unreliable this week and no notes line concerns seasonal-decor or Store 118. Model: "No notes line mentions seasonal-decor or Store 118, and the POS is unreliable this week" -- cause unknown, no…
malformed_json
Whole-batch JSON parse failure
5
EB-0040: the reply's narrative string was never closed with a quote before the final brace, despite finish_reason 'stop' and only 697 of 2,200 output tokens used -- not a budget cutoff. All five of that batch's material exceptions score as dropped, and no…
fabricated_cause
A non-unknown cause with a citation that was not real and relevant
0
None on either scored tier. Every non-unknown cause cited two real, item-relevant lines from that batch's own notes.
What we could NOT verify
Whether the fast tier's 1-of-40 malformed-JSON reply and the reasoning tier's 3-of-40 item_id-formatting slip are stable properties of either model at these settings, or one-off -- one recorded run per tier is not a history.
Cause-tag agreement and citation fidelity at a notes-log volume larger than this corpus's 6-11 lines per batch, or an item count larger than 5 per batch.
Whether a stricter prompt instruction about the exact item_id format would eliminate the reasoning tier's formatting slip, or just move it somewhere else -- not tried here.
Two compounding causes on one exception, or two items in the same batch sharing a root cause -- this corpus never plants either.
PresenterOpens the private repo. Visible to admins only.
Step 07 of 14Unit cost
Written for: whoever signs off on the bill · Measured over the eval run, per model. Never quoted from a vendor page.
In brief
Tier
Input tokens
Output tokens
p50 latency
Google Gemini 2.5 Flash-Lite
Amazon Nova Pro on Bedrock
the fast tier
1,255.1
501.0
3,865 ms
$0.000326
$0.002607
the reasoning tier
1,255.1
549.125
7,425 ms
$0.000345
$0.002761
The token counts are measured on a real run and belong to this pipeline — which sections are selected, the field schema, the prompt — so they hold wherever you run it. The dollars are those counts multiplied by each vendor's published rate, checked 2026-08-18. Nobody paid these particular bills; they are what the same work would cost you on a card you can sign up to today.
Identical work in both rows — the same query, the same tokens. Only the price list changed. Which is why the token count is the measurement and the dollar is arithmetic you can redo on your own card.
Answering vs gradingAnswering and grading are two separate bills
The grader itself (evals/scoring.py) is pure code and free -- what costs money is the drafting call the grader then scores, priced on the same cards above. A forker re-running this eval on their own corpus pays the drafting bill, not a second judge-model bill.
Cost driversWhat actually moves the bill
The merchant notes log, sent whole on every call regardless of how many items are material -- 809-1,188 characters per batch in this corpus, the dominant share of input tokens.
The number of material exceptions in the batch -- more flagged items means a longer evidence block and a longer expected answer list.
Which model tier is called -- the reasoning tier costs roughly 3.2x the fast tier's per-query price for a WORSE completeness figure on this run.
A batch is called even when zero items are material -- 1 of 40 batches this run (EB-0013) spent 903 input tokens confirming an empty review, because src/brief.py has no early-return on an empty packed list.
Your volumeWhat it costs at your volume
Linear in the number of batches, because each call is independent and the notes log is capped at 40 lines (src/pack.py::MAX_NOTES) regardless of batch count. Ten times the batches is ten times the calls and, to the token, ten times the bill -- nothing here shares a payload across batches.
Where pricing changes shape
src/pack.py truncates a batch to 20 items and 40 notes lines -- a batch that exceeds either ceiling stops growing its own cost per call, but a truncated batch is a batch this kit never measured completeness or cause-tag agreement against.
Your return, with your numbers
Volumeone call per review batch, however many batches a region or department reviews per cycle
What it replacesa demand planner manually pulling recent POS, lost-sales/OOS flags, the promo calendar and the prior-year analog per flagged item, then reading the notes log to guess a cause
Time saved per itemnot measured -- this run timed the model call (latency_p50_ms), not a human analyst's own evidence-assembly time on the same batches
We publish the inputs, not a return: a return depends on your labour cost and your volume. The ROI dashboard takes it from here, and AI Costing explains the math.
Model choiceWhy this model
It is the tier the shared key is pointed at, and it is the cheap one -- the right place to start a question whose answer might be 'the free floor already wins part of this', which on exception completeness it very nearly does. The reasoning tier was run too, at roughly 3.2x the price, and lost on both axes that moved (completeness, precision) for no gain on the two that held (cause-tag agreement, narrative faithfulness) -- see cost_by_model.
Other modelsOn other models
This is arithmetic, not a run. No model below was executed against the labelled set, and no accuracy is claimed for any of them. What transfers is the input volume: retrieval is model-independent, so every model would receive the same passages.
50,204input tokens · this run
20,040output tokens
$0.013what it actually cost
Every fast-tier model number on these pages: 40 batches, one call each.
Model
Provider
One eval pass
This whole run
Per 1,000 queries
Rates as of
gpt-5-6-luna
OpenAI
$0.034
$0.034
$0.85
2026-09-12
gemini-3-flash
Google
$0.085
$0.085
$2.13
2026-09-18
gemini-3-8-flash
Google
$0.113
$0.113
$2.82
2026-09-18
llama-5
Meta
$0.148
$0.148
$3.70
2026-09-18
claude-haiku-4-5
Anthropic
$0.150
$0.150
$3.76
2026-09-12
grok-4-5
xAI
$0.221
$0.221
$5.52
2026-09-18
grok-4-6
xAI
$0.221
$0.221
$5.52
2026-09-18
claude-sonnet-5
Anthropic
$0.301
$0.301
$7.52
2026-09-12
gemini-3-1-pro
Google
$0.341
$0.341
$8.52
2026-09-18
gpt-5-6-terra
OpenAI
$0.341
$0.341
$8.52
2026-09-12
gpt-5-6-sol
OpenAI
$0.602
$0.602
$15.04
2026-09-12
claude-opus-4-8
Anthropic
$0.752
$0.752
$18.80
2026-09-12
claude-opus-5
Anthropic
$0.752
$0.752
$18.80
2026-09-12
claude-fable-5
Anthropic
$1.504
$1.504
$37.60
2026-09-18
claude-fable-5-1
Anthropic
$1.504
$1.504
$37.60
2026-09-18
gpt-6-astra
OpenAI
$1.504
$1.504
$37.60
2026-09-17
Read this against the numbers above
NOT MEASURED. Not one of these rows was run. They are this run's measured token counts multiplied by a published rate.
Rates are as of each row's own rates_as_of date and nothing checks them against the vendors on an ongoing basis.
Token counts are not comparable across providers -- a sibling kit measured two tiers of one vendor counting a byte-identical prompt differently.
Nothing here includes retries; this kit's two real runs had very few (finish_reason was 'stop' on all 80 calls; one fast-tier reply was malformed JSON despite that, not a retry).
A cheaper row is not a cheaper kit -- the free always-unknown floor costs $0.00 and its completeness figures are published beside every model row in Eval.baseline.
PresenterOpens the private repo. Visible to admins only.
The codeEvery file, and what it is for
Eight modules, no framework, and almost no dependencies. The pipeline is stdlib Python, because a kit is meant to be read and changed by someone who cloned it ten minutes ago — every dependency is a thing they have to understand before they can touch the part they came for.
Four of these are swap seams: the points you edit to make the kit yours. Each is marked, and each block below is the module’s real shape, read out of the file rather than written here.
The files on this page are not in the public GitHub catalog.
tools/build_corpus.pycorpus generator — a swap seam
Generates 40 review batches, 200 flagged item/location candidates across five categories each, a merchant-notes log per batch and the gold exception list, from a fixed seed. Seven scenarios are planted, each with a KNOWN true cause (or none, on purpose) -- see data/SOURCES.md.
You change it to: Point it at your own forecast/actuals feed and your own flagged candidates -- a reorder-point exception, a staffing-plan exception, anything an automated baseline flags against an actuals feed. src/segment.py, src/pack.py and src/prompt.py do not change.
SEAM -- flags which item/location candidates are material (recent POS vs. the statistical forecast beyond a stated threshold, or evidence itself flagged unreliable). Pure code, no model. The SAME threshold the generator was sized against, imported by both -- see src/segment.py's own header.
You change it to: MATERIALITY_PCT is a module-level constant read once at import time -- change the percentage, or add a second gate, without touching the prompt.
src/segment.py
# SEAM 1 -- the cut. Deciding which flagged item/location exceptions in a review batch are

MATERIALITY_PCT = 18.0
def flag(item):
def flag_batch(batch):
def material_exceptions(batch):
src/rubric.pythe rubric — a swap seam
The five-member cause vocabulary and the three graded axes (completeness, cause-tag agreement, narrative faithfulness), declared once and imported by the prompt, the app and the scorer so they can never silently drift apart.
You change it to: CAUSE_VOCAB and CAUSE_MEANINGS are the single source the prompt, the app and the scorer all import -- add a sixth cause here plus template notes in tools/build_corpus.py, not in the prompt text directly.
src/rubric.py
# The rubric this kit's exception brief is graded against -- the fixed cause vocabulary and the

CAUSE_VOCAB = (
CAUSE_MEANINGS = {
RUBRIC_AXES = (
FABRICATION_GUARDRAIL = (
src/pack.pyPack
Deterministic assembly of one batch's material-only exception list and its notes log into the context the model sees, capped to a stated budget. Pure code -- a clean item never reaches the model.
src/pack.py
# SEAM 2 -- Pack. Deterministic assembly of one review batch's material exceptions and its

MAX_NOTES = 40
MAX_ITEMS = 20
def pack(batch, notes, exceptions):
src/prompt.pythe prompt
The cause vocabulary, the per-item answer schema and the narrative instruction, declared once and read from here by the prompt, the parser and the app.
src/prompt.py
# Assemble the one prompt this kit sends per review batch, and parse the one reply it gets back.

MAX_TOKENS = 2200
SYSTEM = (
DEFAULT_PROMPT = "v1"
SYSTEMS = {"v1": SYSTEM}
def _item_block(packed):
def _notes_block(packed):
def build(packed, prompt=DEFAULT_PROMPT):
def parse(raw):
src/adapters/__init__.pythe model adapter — a swap seam
SEAM -- the model. Raw HTTP for every provider, stdlib only.
You change it to: .env plus the same run again. Any OpenAI-compatible provider or Anthropic.
src/adapters/__init__.py
# SEAM 1 — the model. Swapping provider or model is .env plus the same run again.

class AdapterError(RuntimeError):
TRANSIENT = {408, 429, 500, 502, 503, 504}
RETRIES = 4
def _post(url, headers, payload, timeout=120):
def openai_compatible(cfg, system, user, max_tokens, thinking=None):
def anthropic(cfg, system, user, max_tokens):
PROVIDERS = {"openai-compatible": openai_compatible, "anthropic": anthropic}
THINKING_OFF = {"type": "disabled"}
def complete(cfg, system, user, max_tokens=1024, thinking=None):
src/brief.pythe AI layer
Loads one batch, flags and packs its material exceptions, calls the model once, parses the reply. The whole AI layer, deliberately short.
src/brief.py
# SEAM 3 -- the AI layer. Loads one review batch, segments and packs its material exceptions,

HERE = os.path.dirname(os.path.dirname(os.path.abspath(__file__)))
DATA = os.path.join(HERE, "data")
def _read_jsonl(path):
def batches():
def batches_by_id():
def notes_by_id():
def gold_by_id():
def draft(cfg, batch, notes, complete=None, thinking=None, prompt=P.DEFAULT_PROMPT):
src/app.pythe app
Static files and a handful of JSON endpoints on the standard library. Runs the same citation-fidelity check evals/scoring.py runs, on every live draft, before the UI renders it -- not only after the fact in a committed eval result.
src/app.py
# The minimal local UI. Standard library only -- python -m src.app, then open the printed URL.

HERE = os.path.dirname(os.path.dirname(os.path.abspath(__file__)))
UI = os.path.join(HERE, "ui")
PORT = int(os.environ.get("PORT", "8786"))
def _corpus():
class H(BaseHTTPRequestHandler):
def main():
Start hereThe shortest path into it
src/app.pyrun it and click around. It holds no pipeline logic on purpose; every number on screen comes from a module the eval harness already drives.
tools/build_corpus.pyGenerates 40 review batches, 200 flagged item/location candidates across five categories each, a merchant-notes log per batch and the gold exception list, from a fixed seed. Seven scenarios are planted, each with a KNOWN true cause (or none, on purpose) -- see data/SOURCES.md. A swap seam.
src/segment.pySEAM -- flags which item/location candidates are material (recent POS vs. the statistical forecast beyond a stated threshold, or evidence itself flagged unreliable). Pure code, no model. The SAME threshold the generator was sized against, imported by both -- see src/segment.py's own header. A swap seam.
src/rubric.pyThe five-member cause vocabulary and the three graded axes (completeness, cause-tag agreement, narrative faithfulness), declared once and imported by the prompt, the app and the scorer so they can never silently drift apart. A swap seam.
src/pack.pyDeterministic assembly of one batch's material-only exception list and its notes log into the context the model sees, capped to a stated budget. Pure code -- a clean item never reaches the model.
src/prompt.pyThe cause vocabulary, the per-item answer schema and the narrative instruction, declared once and read from here by the prompt, the parser and the app.
src/adapters/__init__.pySEAM -- the model. Raw HTTP for every provider, stdlib only. A swap seam.
src/brief.pyLoads one batch, flags and packs its material exceptions, calls the model once, parses the reply. The whole AI layer, deliberately short.
Every entry above is a file in this kit, listed in the order the pipeline runs it.
PresenterOpens the private repo. Visible to admins only.
ScenariosWhat it costs at your volume
Everything below is computed from one measured base: 1255 input and 501 output tokens per query, all of it fixed — this kit sends the document's own selected sections, so there is no retrieval depth to turn. Change the volume and the bill scales linearly, because nothing here batches.
Grading really is free here, and that is a property of the ruler rather than a discount
This kit is graded by pure code — the grader makes no model call, needs no key and sends nothing anywhere, so the grading line above is zero at every sampling rate and the leak count stays at nought. What that buys is a ruler you can run on every row, every time, for nothing. What it costs is reach: a code grader can only check what is mechanically checkable.
OperationsFour shapes of workload
The same arithmetic, at volumes worth naming. These are illustrations of scale, not measurements of anyone’s deployment.
Shape
Querys/day
Per day
Per month
Per year
Model follows the controls above.
What this ignoresWhere a real bill diverges
Read before quoting any of it
Output length is assumed constant.A terser or more verbose model moves it, and output is priced above input everywhere.
No volume, committed-use, batch or cache discount is modelled.Each moves real enterprise pricing and none are on a public rate card.
Longer documents cost more and nothing here caps them.This kit selects the document’s own sections in pure Python, so there is no vector store to price — but a corpus of longer records raises the input tokens per query directly, and that is the very number every figure above multiplies.
Grading adds nothing to this bill, and would if you changed the ruler.A code grader is free and local; swapping in an LLM judge would cost more per row than the extraction itself and send every row to a vendor. The instrument is a cost decision, not a footnote.
Rates age.Every one carries the date it was read on the cost page.
PresenterOpens the private repo. Visible to admins only.
In one lineWhat this kit exposes
No untrusted external input surface. Every fact in the prompt -- the forecast, actual POS, OOS/promo flags, the prior-year analog, and the merchant notes log -- is computed directly from this kit's own generated corpus (tools/build_corpus.py, src/segment.py); nothing arrives from outside the codebase the way an inbox message or an ingested document does on sibling kits.
The provider key lives only in .env (gitignored) or the shared repo-root .env, read by src/config.py and never logged. src/app.py strips api_key and base_url out of any exception message before it reaches the browser, so a misconfigured key cannot leak into a UI error.
The experimentWe did not attack it -- there is no surface to attack
An indirect prompt injection needs a field an outside party controls that reaches the prompt. This kit has none, so the four rows below are boundaries confirmed by reading the code, not payloads run through it. Confirmed by reading the code, not by a run, on 2026-08-18 -- no attack run was fired; see the experiment section for why.
Boundary checked
What could go wrong
What the code guarantees
Does the brief's cause tag or citation ever reach a forecast-write store?
A drafted cause could plausibly trigger a write back to the statistical forecast, or a 'corrected' value.
No code path does. src/app.py's /api/draft and evals/run.py both return an answer only; neither writes to data/batches.jsonl or any other store -- confirmed by reading every call site (see Guardrails.holds).
Can a non-'unknown' cause reach a reader with a fabricated or off-item citation?
A model could assert a specific cause and a plausible-looking but fabricated or off-item citation, which a reader would trust as evidence.
src/app.py runs the identical fabrication check evals/scoring.py grades the real run with (citation_is_real and citation_is_relevant) on every live draft, before the UI renders it, and marks any non-unknown cause whose citations fail either check -- confirmed by reading /api/draft.
Is the materiality/flagging decision something a prompt or a reply can move?
A crafted item description could shift which deviation counts as material, widening or narrowing what gets itemized.
src/segment.py::MATERIALITY_PCT is a module-level constant, read once at import time -- nothing the model returns is consulted when deciding which items are material; the packed exception list is built before the model is ever called.
Could a misconfigured provider key leak into a UI-visible error?
An exception raised from a bad key or base URL could echo the secret back to the browser.
src/app.py's /api/draft handler strips api_key and base_url out of any exception message before returning it -- confirmed by reading the handler (see key_handling).
Each boundary above was checked by reading the call sites, not by an attack trial -- there is no untrusted field to construct a payload against (see posture).
The result0 attack trials, by design -- but 4 boundaries around the model's reply hold, confirmed by reading the code, and the fabrication guardrail runs live, not only in a committed eval result.
0untrusted input fields identified
0 of 0attack trials run
n/adecision-flip resistance -- no such surface exists
This kit has no field an outside party controls that reaches the prompt -- the forecast, actual POS, evidence flags and the notes log are all computed from data tools/build_corpus.py generated, never from correspondence, a document, or any other externally supplied text. A future version that ingests real merchant notes from a live external system would reopen this question and should be attacked before shipping.
Read this twice
This is a code read, not an attack run. This kit has no ingested document and no external correspondence -- every fact in the prompt is computed from its own generated corpus, so there is nothing for an outside party to write an instruction into. What the four boundaries above guarantee is narrower: even a wrong or adversarial model REPLY could not write a forecast value, could not move the materiality threshold, and could not show a reader a fabricated citation without it being flagged, because none of those paths trusts the model's output unchecked.
HonestyWhat this does not prove
Whether a future version of this kit that ingests real merchant-notes text from a live external system (rather than a generated corpus) would reopen an injection surface. Not applicable to the shipped version; worth re-examining if this kit is ever pointed at a live notes feed.
PresenterOpens the private repo. Visible to admins only.
In one lineThe guardrail is enforced in code
Not a prompt instruction the model can ignore — a comparison applied after the reply is parsed, before anything downstream sees it.
the guardrail, verbatim
A non-'unknown' cause is shown only alongside its two citations, and every citation is checked as a real, item-relevant line from that batch's own notes before the UI renders it. No code path in this kit writes to a forecast value or recommends accepting/overriding one.
src/app.py's /api/draft endpoint and evals/run.py both return a per-item cause/citation/note plus a narrative; neither writes to data/batches.jsonl or any other store. There is no forecast-write or apply path in this kit at all.
EvidenceDoes it hold?
What
Measured
No code path in this kit writes to a forecast value
0 of 80 calls across both scored tiers (r001-exception-brief, r002-exception-brief-pro) resulted in any write to data/batches.jsonl or any other store -- src/app.py's /api/draft and evals/run.py both only ever return an answer.
Every non-unknown cause's citations are checked before the reader sees them
src/app.py runs the fabrication check on every live draft; across both scored tiers, 0 of 220 matched, non-unknown-cause items (86 fast-tier + a further mix on reasoning-tier) had a citation that failed it -- the guardrail had nothing to catch on this run, but it ran on all of them.
The limitWhat a guardrail is not
IT IS NOT A RATE LIMIT, A POLICY CHECK, OR A GUARD THAT WITHHOLDS A REPLY FROM BEING SHOWN. It flags a fabricated citation in the UI; it does not suppress the brief -- a reader still sees the flagged line, marked, per the UI's own '.cite.bad' treatment.
It does not make the cause-tag judgement itself correct -- see the malformed_json finding in Eval.taxonomy and the reasoning tier's item_id-format slip, which this guardrail does nothing to prevent.
It does not validate the narrative's numbers live, independent of the citation check -- narrative faithfulness is graded by evals/scoring.py after the fact in the eval harness, not enforced on a live draft the way the citation check is. See add_first.
A future version wired to a real forecast-write system would need a real, separate approval gate before writing anything; see add_first.
WatchedWhat is watched, and why that one
2runs recorded
0 / 0deterministic metrics exact
+0.0%largest move — latency
0band breaches
—model half · needs provider URL
The kit measures 23 watched figures plus 8 comparability guards and 5 reference constants — three duties, not one list. 0 of the watched are grader rates, each on its own grader page; this board watches the ones that decide when to look again. Each square is one watched figure; filled means the latest run measured it.
15 measured by the latest run8 need the model half
Metric
Owner
Role
Why this one
cause-and-citation-against-gold
The brief's per-item cause tag and citations against that batch's gold exception list, and its narrative against the packed evidence numbers
alarm
dropped_exception; fabricated_exception; wrong_cause; fabricated_cause — alarm on Any fabricated_cause on any run -- the guardrail this kit's own atlas facet sheet names first. Both scored tiers had zero.
GuardsBefore any comparison
Preconditions, not alarms. If one moves, the runs were not measuring the same system and nothing else on this board may be differenced.
Guard
Value
If it moves
corpus.doc_count
40
different corpus — nothing is comparable
corpus.bytes
83,593
review batches edited — the count held, the bytes did not
split.count
40
the material exceptions count moved — a different set was scored
split.size_p50
4
the median size of one material exception moved
split.size_p95
5
the 95th-percentile size of one material exception moved
dataset.rows
40
the test set changed — every rate has a new denominator
tokens.context_limit
1,000,000
different model family
index.build_seconds
0.0
no index is built here — a change is in corpus preparation, not an index rebuild
all shared guards held between the recorded runs (batches 40, gold_material_total 139, thinking False) — which is why the history below is allowed to mean anything.
The reference constants — the null-grader baseline, the adjudication matrix, the negative count — are the third duty. They are never re-measured per run: a baseline that moves with the thing it measures is not a baseline.
BandsThe alarm bands
Derived from evidence, never picked: exact-match where two runs reproduced a metric to the digit, wider than the measured same-input drift for latency, one row of the negative class for any rate — denominator printed beside it.
Group
Band
Denominator
Where the band comes from
exception completeness
not yet known
139 material exceptions
A band is the spread between runs of the SAME model at the same settings, and there has been no repeat -- the fast and reasoning tiers are different models, not two runs of one.
cause-tag agreement
0 -- both tiers hit 100% on the items they matched (traceable and unknown gold causes alike), despite being different models
134 (fast) / 133 (reasoning) matched items
measured, both runs
fabricated cause
0 -- zero on both tiers, this run's headline guardrail metric
0 -- 100% on both tiers, a pure input-to-output copy
134 (fast) / 133 (reasoning) matched items
measured, both runs -- every item whose gold data flagged unreliable evidence had that flag echoed back correctly
narrative faithfulness
0 -- 100% on both tiers wherever a narrative was produced
39 (fast) / 40 (reasoning) batches with a narrative
measured, both runs -- the one fast-tier batch with no narrative (EB-0040, the parse failure) is excluded from this rate, not counted as unfaithful
malformed-reply rate
not yet known
40 batches
1 of 40 batches (fast tier, malformed JSON) vs. 3 of 40 batches (reasoning tier, item_id-format slip), one run each, not repeated.
input volume
0 -- identical across models by construction
40 calls
50,204 input tokens on BOTH scored runs, to the token, because prompt assembly is pure code and model-independent.
output volume
not yet known
40 calls
20,040 output tokens on the fast tier, 21,965 on the reasoning tier -- close, but model-specific unlike input.
latency
not yet known
40 calls
p50 3,865ms then 7,425ms, p95 4,723ms then 9,039ms -- the reasoning tier is roughly twice as slow for measurably WORSE completeness. One recorded run per tier, not a distribution.
HistoryRun history
2 recorded runs. A dash is a metric that run did not measure, and a dash is never differenced: not measured is a third state, neither a value nor a zero, and reading it as zero is how a board reports an improvement on a run that never looked.
Metric
r001-exception-brief 2026-08-18
r002-exception-brief-pro 2026-08-18
cause tag agreement, %
100.0
100.0
cause tag agreement traceable, %
100.0
100.0
cause tag agreement unknown, %
100.0
100.0
exception completeness precision, %
100.0
95.7
exception completeness recall, %
96.4
95.7
fabricated cause
0
0
false negative
5
6
false positive
0
6
input tokens, whole run
50204
50204
model latency p50 ms
3865.00
7425.00
model latency p95 ms
4723.00
9039.00
narrative faithfulness, %
100.0
100.0
output tokens, whole run
20040
21965
true positive
134
133
unreliable evidence echo, %
100.0
100.0
not a time series No two of these 2 runs measured the same system — they differ on the model — so nothing here may be differenced and the Verdict column is left off. Read this block DOWN a column, as a comparison between those runs, not along a row as a history.
DeviationsWhat deviated
0 breaches across 2 runs
The day a band breaks, a row renders here carrying the metric, the two runs, the band it crossed and what changed between them — model, prompt, chunker or top_k, read off the run records’ guards. A deviation with no diff beside it is an alarm nobody can act on.
RippleThe ripple map
Which figures move together, so one alarm reads as a system. Every edge carries its basis: measured names the run that showed it; reasoning admits nothing has varied it yet.
Lever
What moves
Basis
Evidence
which model drafts the brief
exception-completeness recall 96.4% -> 95.7%, precision 100.0% -> 95.7%, cost roughly 3.2x higher, latency roughly 1.9x higher -- the reasoning tier trades a different failure mode (item_id-format slip on 3 batches) for the fast tier's (one malformed-JSON batch), at markedly higher cost and latency, with no gain on cause-tag agreement or narrative faithfulness, which hold at 100% on both
measured
r001-exception-brief (fast) vs r002-exception-brief-pro (reasoning), both with thinking disabled, same corpus, same prompt -- one variable, and it moved completeness and precision in the wrong direction while raising cost and latency.
whether the reply complies with the exact item_id schema
a batch's true-positive count from matching its material-exception count down toward zero for the affected items -- a formatting choice, not a judgement difference, decides whether an item counts at all
measured
per_batch breakdown in the reasoning-tier result file: EB-0011, EB-0023 and EB-0032 each show model_covered == gold_material but true_positive == 0, the signature of this exact failure mode.
FiresWhat fires when a band breaks
Where evals stop sitting beside the guardrail and start feeding it. Where the answer is nothing automatic, the row says so — hiding it would undo “What a guardrail is not” above.
Band
What fires
exception completeness
nothing yet
cause-tag agreement
any value under 100% on a re-run
fabricated cause
any nonzero value, on any run
unreliable-evidence echo
any value under 100% on a re-run
narrative faithfulness
any value under 100% on a re-run
malformed-reply rate
nothing yet
input volume
any change without a corresponding change to prompt or corpus
output volume
nothing yet
latency
nothing yet
NextThe three you would add first
A live narrative-faithfulness check, the same shape as the live citation checkThe citation-fidelity check runs live in src/app.py; the narrative-faithfulness check (evals/scoring.py::narrative_faithfulness) currently only runs in the eval harness, not on a live draft -- a reader of the UI has no equivalent flag today.
A real apply path behind an explicit human-approval stepPer the atlas row's own guardrail (assembles evidence, never decides), nothing here should ever write a forecast value without a person confirming it first -- and there is currently no apply path of any kind to gate.
A schema-validation pass on item_id before any downstream system trusts it3 of 40 reasoning-tier batches (6 items) returned an item_id with the label and location appended, which this run's own exact-match scorer correctly rejected -- a real integration keying on item_id needs the same rejection before it trusts the field.
None of these is built here. They are named against the seam they sit on so they can be argued with.
CadenceWhen to re-run, and what it costs
Re-run evals/baseline.py (free) on any threshold change in src/segment.py. Re-run evals/run.py (paid, one call per batch) on any change to src/prompt.py, src/segment.py, src/rubric.py or the corpus generator.
What this cannot tell you
One recorded run per tier is not a history -- whether the malformed-JSON rate (fast tier) and the id-formatting slip rate (reasoning tier) are stable across repeated runs on the same corpus has not been measured.
Whether a stricter prompt instruction about the exact item_id format would eliminate the reasoning tier's formatting slip -- not tried here.
Whether a real deployment's own notes-log volume (likely far more than this corpus's 6-11 lines per batch) would change the fabrication or completeness figures.
PresenterOpens the private repo. Visible to admins only.
In one lineNo framework, deliberately
This kit has no framework and no dependencies at all -- json, re, urllib and http.server from the standard library. requirements.txt is an empty file with a comment explaining that the emptiness is load-bearing.
The mappingSeam by seam, who owns what
Seam
File here
Framework equivalent
Note
the cut
src/segment.py
rules engines, forecast-exception platforms
at one materiality threshold and one unreliable-evidence check, a rules engine is more machinery than the arithmetic it would replace
one completion call in one shape is small enough that stdlib is honestly the right size, and it keeps the fork test to one install
the outcome vocabulary and grading
src/rubric.py, evals/scoring.py
eval harnesses (promptfoo, DeepEval)
five causes, three graded axes and a substring check is a dict comprehension, not a platform
The seams are the ones this kit already publishes, so the mapping cannot drift from the code.
GraphsWhere LangGraph changes the answer
Nothing here is a graph. The pipeline has one path per batch -- flag, pack, prompt, call, parse, score -- with no branching and no state carried between batches. A framework would add an orchestrator to a for-loop.
The other sideWhat a framework costs you
A cause outside the five-member vocabulary needs a hand-written CAUSE_VOCAB entry plus new template notes lines in tools/build_corpus.py, rather than being configured declaratively.
There is no built-in retry/backoff beyond src/adapters.py's own bounded retry -- a framework's queue and worker model is not here, so a real deployment adds its own scheduling.
No built-in observability beyond what evals/run.py prints and writes to results/ -- a framework's tracing/dashboard integration is not here.
What we could NOT verify
No port to any framework was actually built, so the comparison above is reasoning about the seams, not a measured alternative implementation.
PresenterOpens the private repo. Visible to admins only.
In one lineWhat one run of this kit actually cost, in time and tokens
Measured on r001-exception-brief on the fast tier, 2026-08-18. This kit records telemetry measured per run — 4 of the 6 readings on this axis, 4 of them with a band the guardrail board can judge against.
The readingWhat the last run measured
Reading
Last run
Band
What fires
Model, median
3,865 ms
not yet known
nothing yet
Model, p95
4,723 ms
not yet known
nothing yet
Input tokens
50,204
0 -- identical across models by construction
any change without a corresponding change to prompt or corpus
Output tokens
20,040
not yet known
nothing yet
No movement column. Not one of the 1 earlier run on record is comparable with this one — a different model tier, or a changed guard — and differencing across that measures two systems rather than one. Said once here rather than as a dash on every row.
Retrieval not shown. No run of this kit has ever recorded a retrieval timing, because the pipeline has no such stage. Those readings are left out rather than dashed: a dash says “this run did not measure it”, which promises a later run could.
DriftMedian call, run over run
r001-exception-brief3,865 ms
r002-exception-brief-pro7,425 ms
Hatched bars are runs that are not comparable with the latest — a different model tier or a changed guard. They are drawn because hiding them would make the history look shorter than it is, and greyed because differencing across them would be measuring two systems.
The other sideWhat this does not tell you
What we could NOT verify
No stage-by-stage span tree. These are whole-call timings; which part of the pipeline spent the time is not recorded by this kit's harness.
Latency is a run-level median and p95. The spread between the fastest and slowest single call is not stored, so the distribution cannot be drawn.
No earlier run is comparable to this one (a different model tier or a changed guard), so nothing on this page is a trend yet.
One machine, one network, one region. Latency includes the provider round trip from a single location and will not transfer to yours.
The first of those is the one worth doing something about, and it is a solved problem: instrumenting a pipeline so each step reports its own duration is a couple of lines. Observability / tracing has the code, and what the result looks like once it is running.
PresenterOpens the private repo. Visible to admins only.
In one lineWhat you provision, honestly
Everything measured on this page says where it was measured; everything not measured says that — the same contract as the other thirteen pages. Where a retrieval index would be on other kits, this one has: no index — one document is one unit, whole into one call.
The machineWhat this needs
Dependencies
nothing beyond the standard library — requirements.txt names no package
Configuration
7 environment variables — the full knob table is at the bottom of this page
Last verified run
2026-08-18, across 2 committed records
Enumerated from the kit’s own source by build/facts/envscan.py, committed, and drift-checked — never typed into this page.
Your dataWhere everything sits
Artifact
Where
Leaves your machine?
review batches and evidence packets
data/batches.jsonl -- 40 batches, 200 flagged item/location candidates, generated once from a fixed seed by tools/build_corpus.py
read by id in src/brief.py and src/app.py; never modified after generation
merchant notes
data/notes.jsonl -- 40 rows, committed, generated with the batches
read whole per batch by src/pack.py; never cached or filtered before the model sees it
gold exception list
data/gold.jsonl -- 40 rows, computed by tools/build_corpus.py and src/segment.py::flag at generation time, from a scenario decided before any materiality check runs
never -- evals/scoring.py is pure code, no model, no key
the key
.env -- never committed
only inside the Authorization header, to the configured BASE_URL (src/adapters/__init__.py)
The wireWhat crosses it, and when
Runtime call site
Destination
src/adapters/__init__.py line 55
the configured BASE_URL
Build-time (corpus tooling, run once)
Destination
none — this kit’s corpus is generated locally
Zero-egress topology: point BASE_URL at a local OpenAI-compatible server and nothing leaves the machine — statically true of the shipped adapter, whose only credential travels in the Authorization header.
The third state
What the provider retains, trains on or logs once a request arrives is not measured here — it is provider-dependent, and this page does not assert what no run of ours can verify.
The shapeHow it ships, and what you add
The key
The provider key lives only in .env (gitignored) or the shared repo-root .env, read by src/config.py and never logged. src/app.py strips api_key and base_url out of any exception message before it reaches the browser, so a misconfigured key cannot leak into a UI error.
You add
your reverse proxy and your identity in front of one process — the kit deliberately ships neither, because identity belongs to your estate, not to a kit
Never ships
Docker, Helm, a queue, a database. The product is a folder of readable Python; what to run it under is this page’s job to state, not the kit’s job to impose
The ladderEach decision, and what you provision past its ceiling
Decision
The kit ships
Measured here
Past the ceiling
What stops being valid
corpus refresh
tools/build_corpus.py regenerates the whole corpus -- 40 batches, 200 flagged item/location candidates, the notes log and the gold exception list -- byte-identically from a fixed seed (SEED = 20260818) every time it is run. There is no incremental refresh and no partial rebuild; the materiality bar (src/segment.py::MATERIALITY_PCT, 18%) is a stated constant read fresh from the forecast/actual pair on every request, not baked into the corpus at generation time.
0.04s wall time to regenerate all 40 batches, 200 items and their notes, measured 2026-08-18 -- see Data.index. (lenses.Data.index, tools/build_corpus.py)
a real deployment's actuals feed changes continuously, not on a fixed seed -- how often a real exception queue needs re-flagging (and whether a stale evidence packet could sit in the notes log alongside a fresher exception) was not measured
point tools/build_corpus.py at your own forecast/actuals feed and your own flagged candidates, and every published completeness/cause figure is void -- they are this corpus's own scenario shapes (see Data.breaks_on), not a property of the model
model
one call per BATCH carrying every material exception plus the notes log, behind src/adapters/__init__.py, reasoning disabled -- the configuration both scored runs ship. The call is made unconditionally, even when the packed item list is empty -- see Architecture.breaks_at_scale.
40 of 40 fast-tier and 40 of 40 reasoning-tier batches returned a reply that parsed as valid JSON, except 1 of 40 fast-tier batches (EB-0040, an unterminated narrative string); every reply's finish_reason was 'stop'. (lenses.Eval.scores, r001-exception-brief and r002-exception-brief-pro)
the 2,200-token ceiling was never exhausted on either run -- headroom, not a target, per src/prompt.py's own MAX_TOKENS
verdicts are per-model and no configuration ran twice -- the two tiers do not tie: the reasoning tier costs roughly 3.2x more for a WORSE completeness and precision figure, and the scorer re-runs free on yours
labels
data/gold.jsonl, 40 rows covering 200 flagged candidates -- each item's scenario, true cause and (for four of seven scenarios) its exact two explanatory notes lines are decided by tools/build_corpus.py before src/segment.py's materiality check ever runs on the same batch
139 of 200 flagged candidates are gold-material; of those, 86-87 have a traceable gold cause and 46-48 have gold cause 'unknown' by design (unreliable evidence or a genuinely unexplained exception) (lenses.Eval.dataset, exception-brief-2026-08-18-40batches)
your own flagged candidates: hand-decide which exceptions are real and why, which is the real work -- this kit's gold is a luxury of controlling the generator, and hand-adjudicated gold has an error rate this kit has never measured
cause-tag agreement and citation fidelity over this set reflect THIS corpus's four templated cause-phrasings -- a real deployment's merchant notes (see Data.bring_your_own_boundary) are untested
Every threshold is a measurement with its provenance beside it, or says is_measured:false. A ceiling with no seam says so — it is the point the kit is outgrown, never a forced join.
When it failsFailure signatures
What you see
What it is
First move
a genuinely-clean flagged candidate never appears in a brief, and a genuinely-flagged one always does
the materiality bar (src/segment.py::MATERIALITY_PCT = 18% deviation, or unreliable evidence by itself) sat with headroom on both sides of this corpus's planted noise (+-5%) and planted defect shift (22-48%) -- 0 of 200 candidates landed ambiguously close to the bar at generation time
if a real deployment's own ordinary forecast noise runs closer to 18% than this corpus's +-5%, re-check MATERIALITY_PCT before trusting which exceptions get itemized -- this threshold was never measured against a real distribution (tools/build_corpus.py, src/segment.py, results/eval-r001-exception-brief.json)
a brief's item set for a batch scores zero true positives despite covering the right COUNT of exceptions
the model echoed item_id with the label and location appended -- 'IT-1 (pet-supplies @ Store 122)' instead of 'IT-1' -- which fails the exact-match join for both items in that batch at once
check the raw item_id strings in the reply before assuming the model missed the exceptions entirely -- 3 of 40 reasoning-tier batches on r002 are this exact formatting slip, not a detection failure; 0 of 40 fast-tier batches show it (results/eval-r002-exception-brief-pro.json, per_batch rows with true_positive=0)
a batch's answer has an empty items list and no narrative
the whole reply failed to parse as JSON -- in the one case measured, an unterminated string in the narrative field, with finish_reason 'stop', not a token-budget cutoff
check raw_text (kept only for batches where items_answered < items_material) rather than assuming the model saw nothing to report (results/eval-r001-exception-brief.json, batch EB-0040)
a batch with zero material exceptions still shows up in the results file with nonzero input/output tokens
src/brief.py calls the model unconditionally, with no early-return on an empty packed item list -- the call still sends the empty 'MATERIAL EXCEPTIONS (0)' block and merchant notes log, and the model still replies with an empty items list and a one-line narrative
do not assume a $0 line item in a cost projection for an all-clean batch -- 1 of 40 batches this run (EB-0013) cost 903 input tokens and 72 output tokens for an empty answer (results/eval-r001-exception-brief.json, batch EB-0013)
No machine symptom — this failure leaves no trace in any output.
src/pack.py's notes log is sent whole and unfiltered by item, so a model that cites a real line from the wrong item's context has no code check blocking it beyond the item-label-substring test in evals/scoring.py::citation_is_relevant -- a citation phrased without the item's own label (this corpus's templates always include it) would pass the substring-and-relevance check while still being a coincidence, and neither this run nor its scorer can currently tell a deliberate citation from a lucky one.
Concurrency and GPU sizing -- one serial call per batch, nothing measured past 40. Provider-side retention, training use and log residency -- provider-dependent, a third state. Whether the provider's prompt cache was hit on any call -- Cost prices every call at the cache-miss rate for exactly this reason. Whether a real deployment's own notes-log volume or cause distribution would reproduce this corpus's completeness/cause-tag figures -- see Data.bring_your_own_boundary. Whether either scored run repeats -- every configuration ran once.
The corpus licence, from the Data lens: MIT -- this repository's own licence Your corpus’s licence is yours to verify, and the labels you write are about your documents.
The brief's per-item cause tag and citations against that batch's gold exception list, and its narrative against the packed evidence numbers
Explain why store sales broke from the forecast
PresenterOpens the private repo. Visible to admins only.
In one lineThe brief's per-item cause tag and citations against that batch's gold exception list, and its narrative against the packed evidence numbers
Did the brief itemize the right set of material exceptions, tag each with the right cause (including 'unknown' when gold says unknown), cite two real, item-relevant notes lines whenever it claimed a specific cause, and state only numbers that are actually in the packed evidence?
$0.00per 1,000 review batches
nodata leaves your network
yessame answer every time
MethodHow the test was run
evals/scoring.py::score, in-process, no key and no model. The same function evals/baseline.py calls, and the same predicates src/app.py runs on every live draft.
The inputOne real row, seen by every grader
Batch
EB-0004
Flagged item
IT-1 -- footwear @ DC-West Pool
Material exception
512 units spread (26.9%) between actual POS and the statistical forecast
Gold cause
promo_uncaptured
The model's cause
promo_uncaptured
Citation 1
footwear: a promo/ad placement was locked in after the statistical forecast was generated -- the baseline never saw it.
Citation 2
Follow-up on footwear -- confirmed the promo calendar entry posted late this cycle; expect POS to keep running up of the stat forecast while it's live.
Scored as
correct_itemized, correct_cause, citations_real
Grader
Verdict
Why
The brief's per-item cause tag and citations against that batch's gold exception list, and its narrative against the packed evidence numbers
correct_itemized, correct_cause, citations_real
EB-0004, IT-1 (footwear @ DC-West Pool): a 26.9% spread (512 units) between actual POS and the statistical forecast. Gold cause: promo_uncaptured. The model independently tagged the same cause, citing two notes lines verbatim -- 'footwear: a promo/ad placement was locked in after the statistical forecast was generated -- the baseline never saw it' and 'Follow-up on footwear -- confirmed the promo calendar entry posted late this cycle; expect POS to keep running up of the stat forecast while it's live' -- both real, item-relevant lines from that batch's own notes log.
The formulaWhat it computes
completeness = |brief items ∩ gold material items| over gold (recall) and over brief items (precision); cause-tag agreement = correct causes / matched items, split unknown vs traceable; fabricated_cause = matched items with a non-unknown cause and a citation that is not both real and item-relevant; narrative faithfulness = batches with zero unmatched quantified claims / batches with a narrative.
The analysisWhat it actually did
Model
Result
the fast tier
96.4% exception completeness recall · 2 more measured on this row
the reasoning tier
95.7% exception completeness recall · 2 more measured on this row
In operationWhat to monitor
Reference standard: The corpus's own gold cause and citations, decided by tools/build_corpus.py at generation time, before src/segment.py's materiality check runs on the same batch. This grader IS the reference, so its own TPR/TNR are not separately measured -- that would be circular.
These rates are UNKNOWN, on purpose
This grader's own error rate is not measured and largely cannot be -- it IS the reference. What can go wrong is the corpus's own planted causes and citations, which come from the generator's fixed templates.
Watch these
dropped_exception
fabricated_exception
wrong_cause
fabricated_cause
Alarm on
Any fabricated_cause on any run -- the guardrail this kit's own atlas facet sheet names first. Both scored tiers had zero.
How tight can the band be? There is no tuned threshold anywhere in this grader: materiality is a stated constant in src/segment.py, and the citation check is a literal substring-and-relevance test, not a fitted score.
Cadence: Re-run on any change to src/prompt.py, src/segment.py, src/rubric.py or the corpus generator.
The decisionWhen to reach for it
Use it
The gold cause and gold citations are known -- true of every kit corpus, never true of a real deployment's own exception queue.
Do not use it
The truth is not known -- the normal state of a real exception review, and the reason this corpus is generated rather than captured.
A living map of modern AI — kept current every morning