A quarterly data check flags too many bad records, but stops at the first system it can name. This app reads the notes underneath and finds the system that actually caused it, even when nobody wrote that step down.
PresenterOpens the private repo. Visible to admins only.
For a data governance analystBanking
Why it matters
Today's manual process, and the same job with the app
A data governance analyst at a bank, checking whether this quarter's failing records point to a new root cause.
✕Today's manual process
1Open the failing-rate report for every critical item this quarter.
2Walk the lineage chart hop by hop, hoping it reaches the real source.
3Read the steward's notes to see if anyone wrote down an earlier step.
4Remember what's already open so the same breach isn't reported as new again.
Every quarter's report read and walked manually
✓With the app
1The failing rate is read against this item's own limit, automatically.
2The chain is walked for you as far as the registered hops go.
3The notes are checked too for a step nobody entered into the registry.
4Only new breaches get flagged never the same one twice while it's still open.
Every breach found once, and only once
See it work
One real case: what it read, step by step
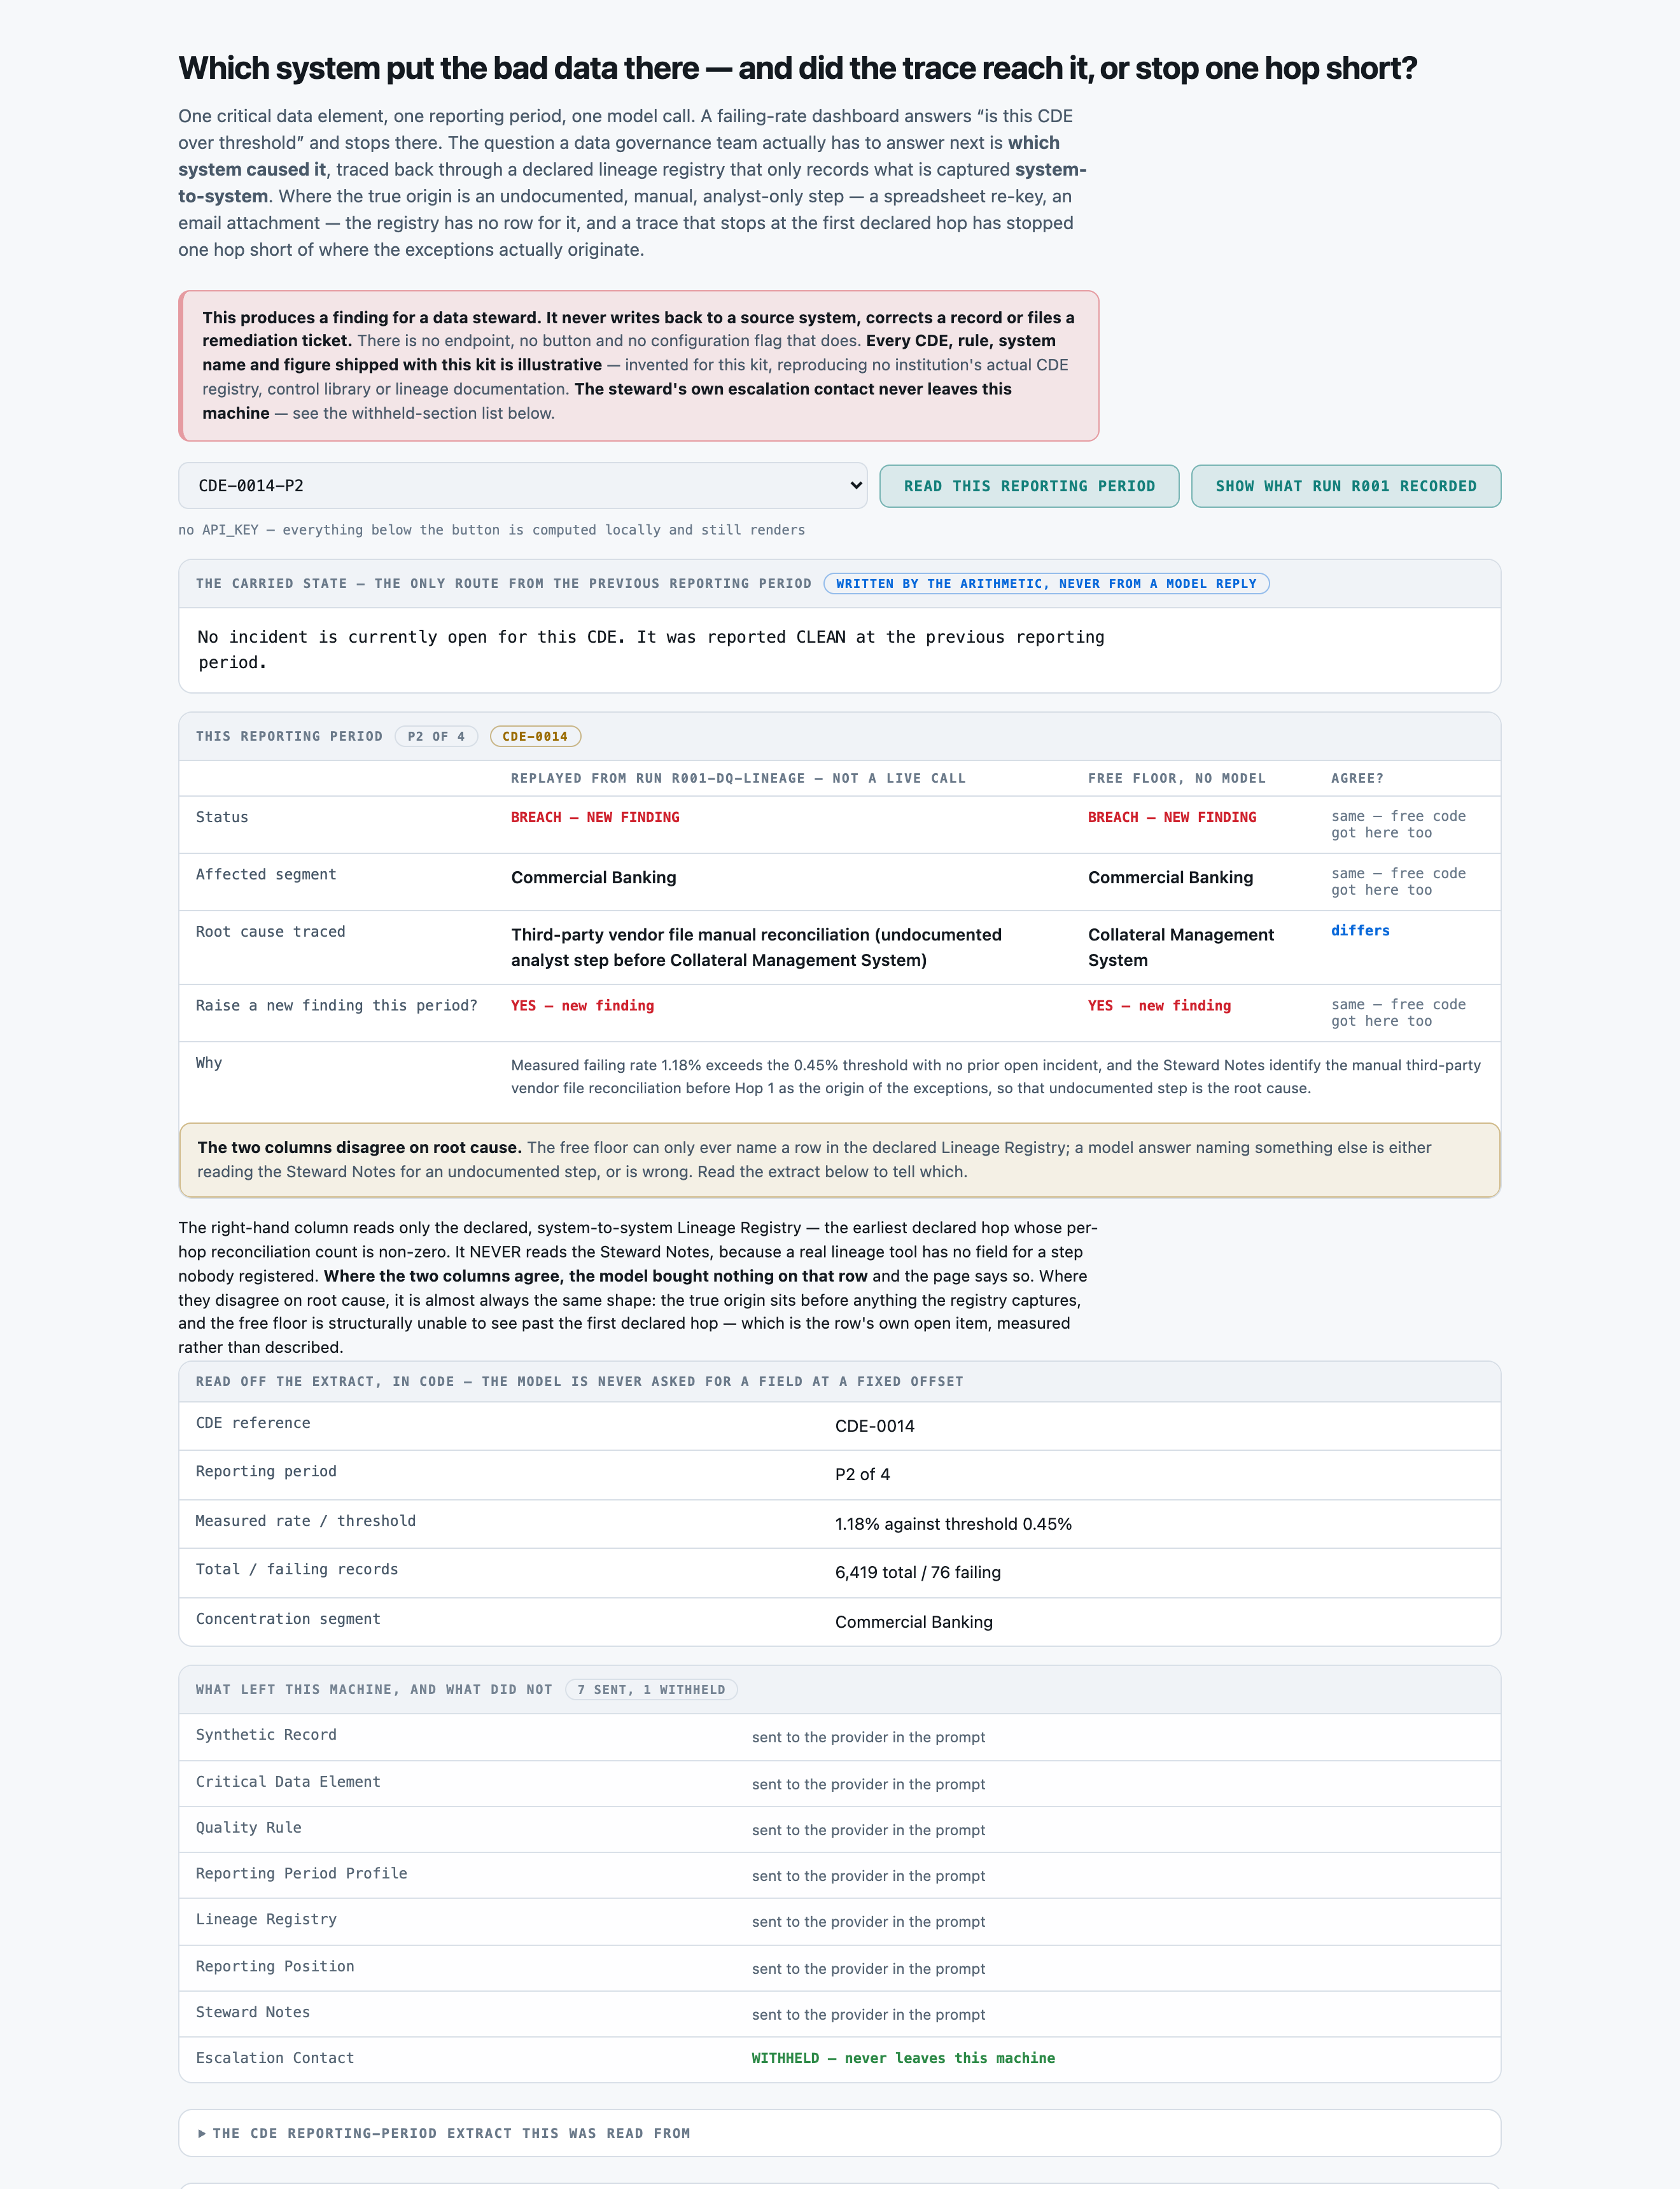
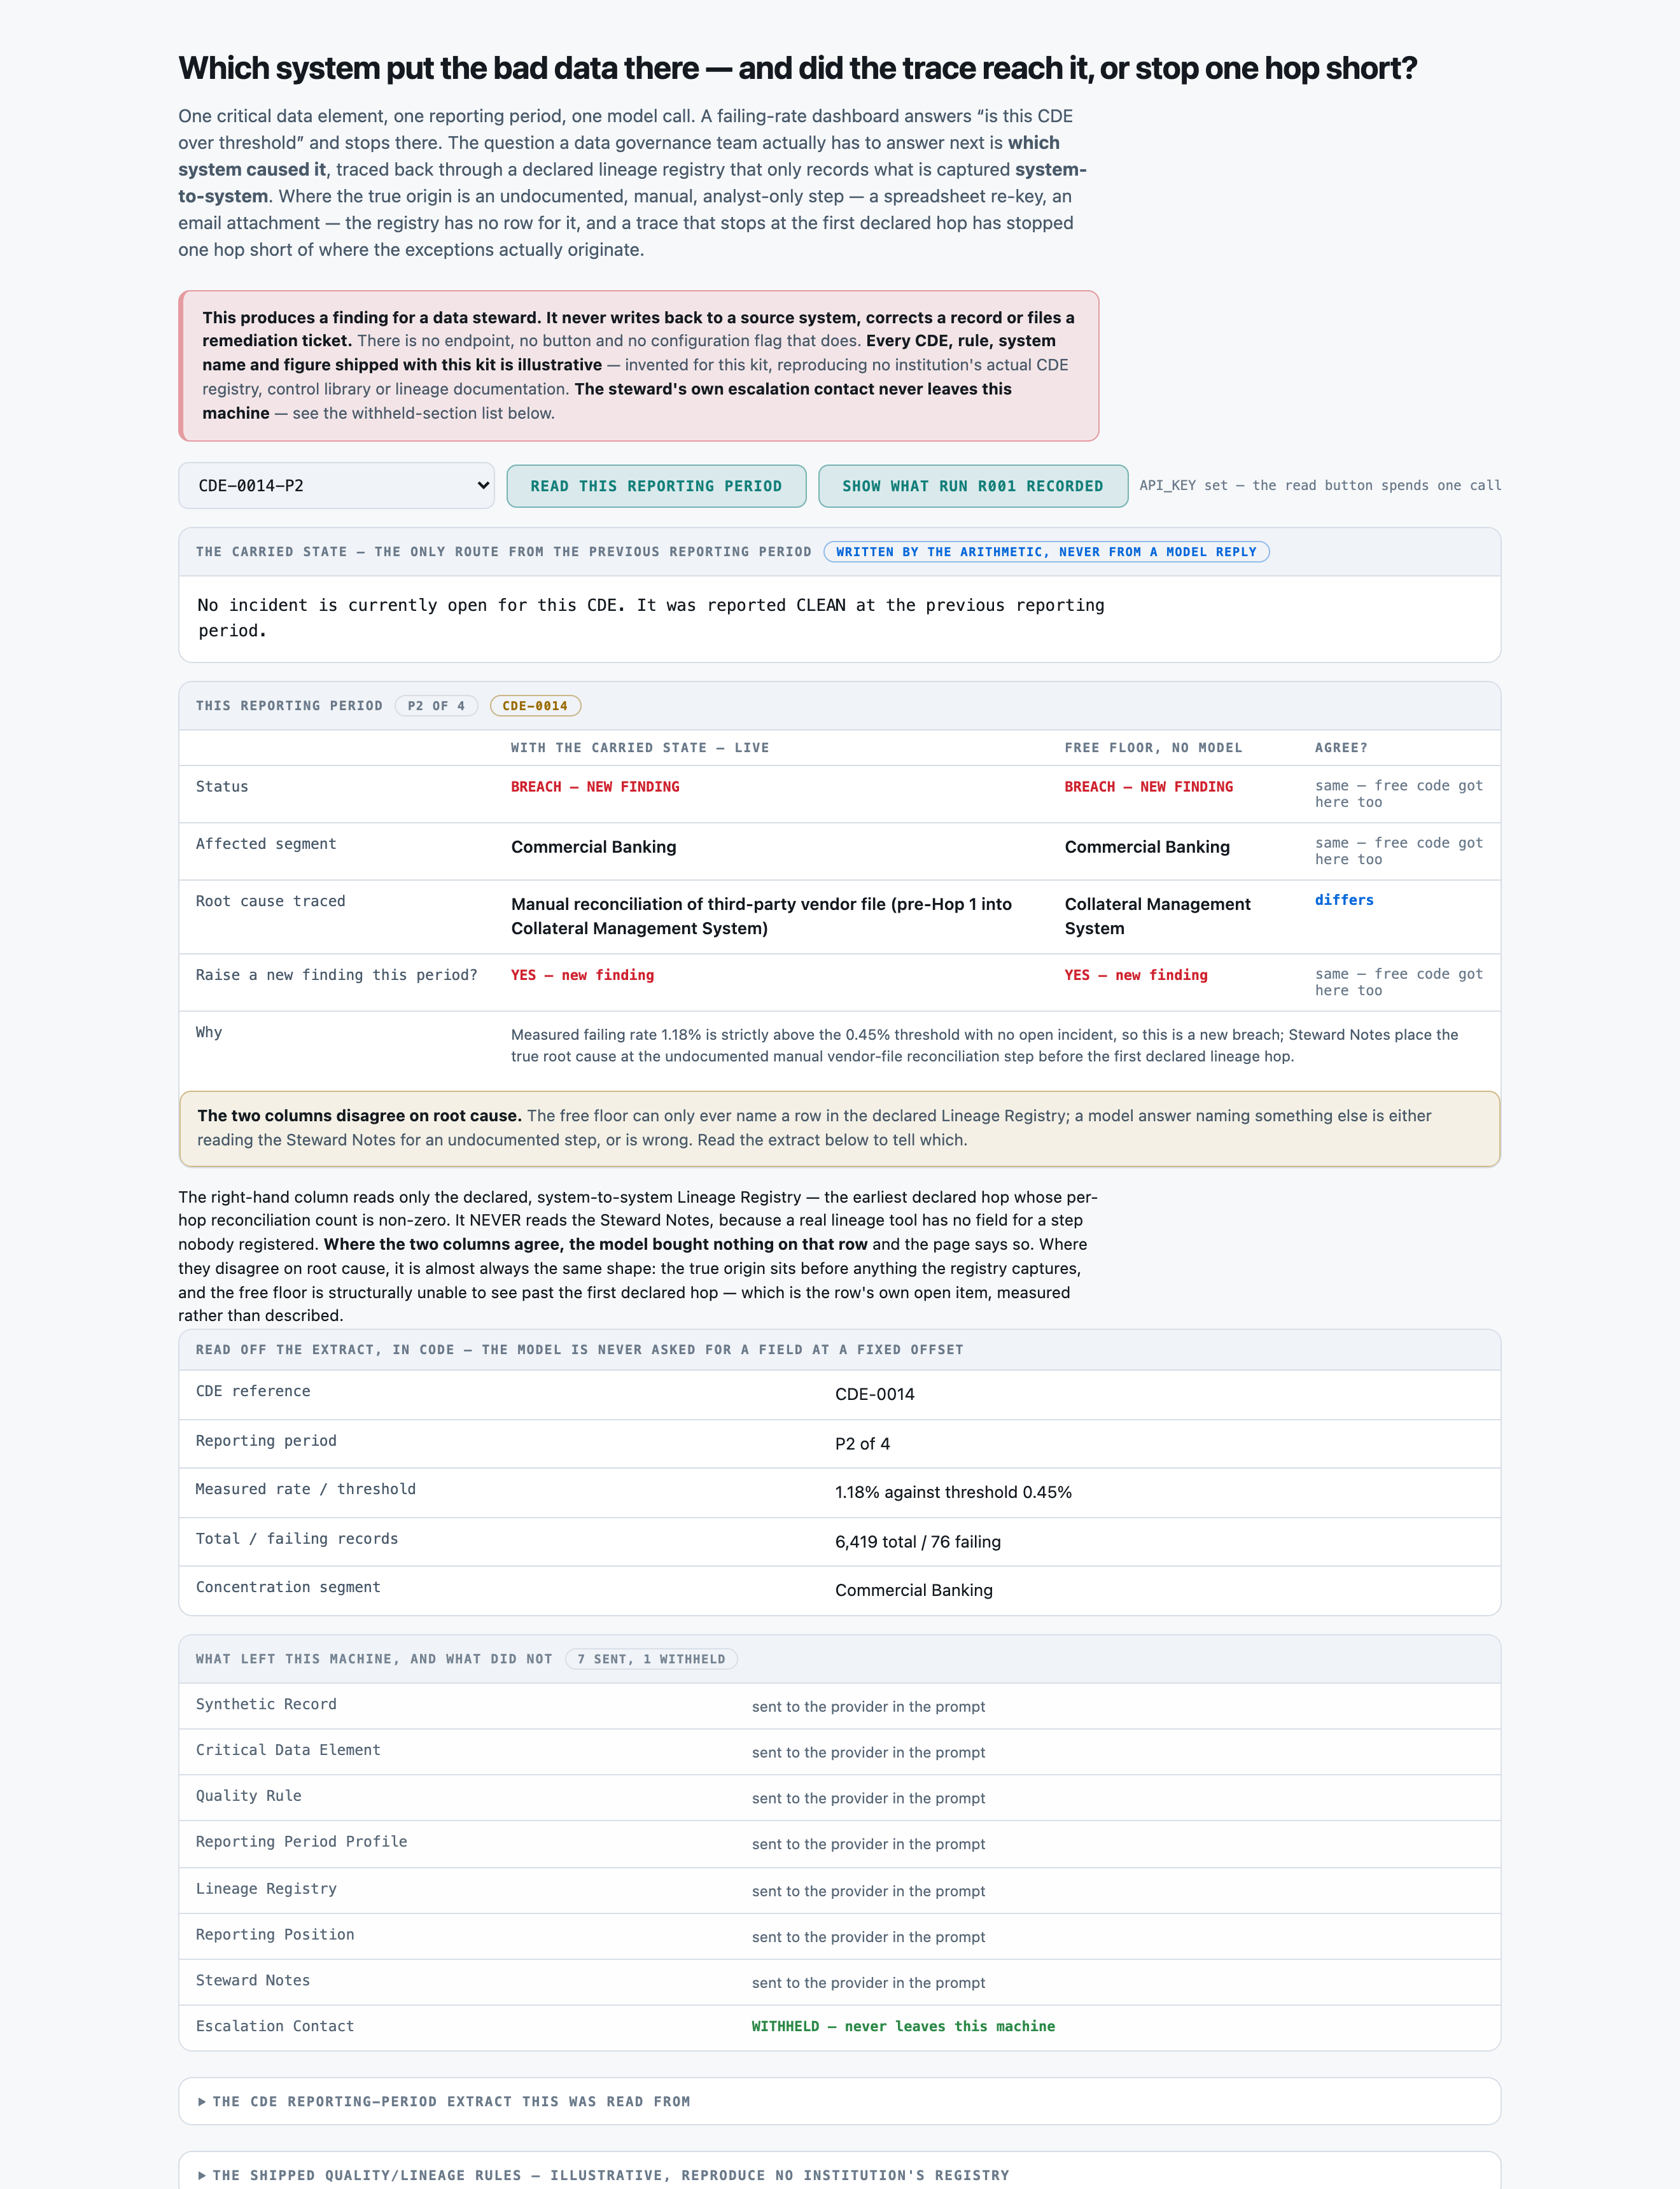
CDE-0014 breaches its limit in Commercial Banking, and the true source is a manual file reconciliation no one had logged.
Trace a bank's bad data back to its sourceReference appBuilt to be shaped to your process
5
1What it found a new breach on this critical item, this quarter.
2The trigger 1.18% of records failing, against a 0.45% limit.
3The proof a manual step before the first system in the registry, named from the notes.
4What doesn't count only the 76 failing records in Commercial Banking set this off, not the rest.
5The outcome raised once, for a steward to check, never repeated while it's still open.
For engineers
How it is built, and how we measured it
All fourteen steps of the build are written up, from the business case to running it in your own environment.
A small, forkable project that does one job end to end. Run once for real, and every figure on these pages captured from that run.
PresenterOpens the private repo. Visible to admins only.
The business caseThe problem this solves
A data governance analyst working a CDE exception report each quarter opens the profiling output for every critical data element, checks whether the measured failing rate breaches its declared threshold, then walks the lineage registry hop by hop and reads the steward's own investigation notes to decide which system is actually at fault -- and has to remember, unaided, whether a finding for this incident has already been raised so the same breach is not reported as new every quarter it stays open. The manual walk from a failing-rate dashboard to a lineage registry to a steward's notes, repeated every reporting period for every CDE, to decide whether this period is a new finding, a continuing one, a closed one, or nothing at all.
Audience
A data governance analyst or CDE owner deciding which finding to route to which system's owning team this quarter, and the steward who has to write the root-cause trace up either way. The free floor gets the structured plumbing exactly as right as the model does -- coverage, affected segment and alerting all tie at 100 pct -- so the column that actually decides whether this is worth running is the one no dashboard can see: root cause on a CDE whose true origin was never registered as a pipeline hop. Every number on these pages came from one real run of this code, not from a vendor page.
The inputThe actual CDE profiles
The corpus is 120 CDE profiles, 0.54 MB (json 1 · jsonl 1 · txt 120).
The corpus
The 120 CDE profilesgenerated from a fixed seed, so no real record, person or institution appears in it.
Where each came fromwritten for this kit rather than collected — the corpus is generated in the kit's own repository, so there is no third-party data in it.
Swap this folder for your own material and the kit is pointed at your CDE profiles. That is the whole change — there is no database to migrate.
One CDE profile, as the model receives itCDE-0001-P1.txt · 1 of 120
Synthetic Record
----------------------------------------------------------------
This is a SYNTHETIC data-governance monitoring record generated for the dq-lineage kit. No real bank, customer, system or person is represented.
CDE reference: CDE-0001   Reporting period: P1 of 4

Critical Data Element
----------------------------------------------------------------
CDE reference           : CDE-0001
Name                    : Days Past Due (Retail Loans)
Owning function         : Credit Risk
Quality dimension       : Accuracy
Definition              : The number of calendar days a retail loan's scheduled payment is overdue, as reported to the risk data mart at each reporting period.

Quality Rule
----------------------------------------------------------------
Failing definition      : A record fails where a record where Days Past Due as reported disagrees with the value recomputed from the servicing ledger by more than 1 day.
Declared threshold      : 0.75%

Rule DQ-1  A CDE is IN BREACH for a reporting period when its measured failing rate for that
          period is STRICTLY GREATER than its declared threshold. Equal to the threshold is
          within tolerance, not a breach.
Rule DQ-2  A finding is raised ONCE per incident, on the first reporting period at which the CDE
          is in breach with no incident already open. A later period that is still in breach
          reports the incident CONTINUING; it does not raise a second finding for the same
          incident (BREACH_ONGOING).
Rule DQ-3  The root cause identified when a finding is raised STANDS for every later period the
          same incident remains open, unless a new instrument in THIS period's Lineage Registry
          supersedes it. It is not re-derived from scratch each period.
Abridged — the file continues.
The outcomeWhat a good result looks like
Every CDE in breach carries exactly one open finding, its affected segment matches what the profiling shows, and its named root cause matches what the steward would go on to confirm -- including the undocumented cases, whenever the evidence for them exists anywhere in the file.
And when it cannot
The scored run made zero missed and zero duplicate alerts across 120 readings, and matched the true root cause on 16 of 18 breach findings (88.89 pct) -- 11 of 11 where the registry alone carries the answer, 5 of 7 where it does not. The two misses are both cases where the steward's own notes had not yet identified a source beyond the registry either: this tool cannot find a fact that exists nowhere in the file, and it does not invent one when it has no evidence -- it answered the same as the free floor on both, rather than guessing.
Where it fitsWhat did work
Every line below is a measured result from this kit's own runs, with the figure that supports it. The headline above is not softened by any of them.
Your lineage registry captures every hop system-to-system with no manual gaps — the free floor in this repo, or an equivalent rules engine over your own registry It ties the model exactly on all three structured fields and on the 11 documented-origin root causes in this run -- 100.00 pct, $0.00, no key.
Your registry has known or suspected undocumented manual steps, and stewards write investigation notes when they find one — the model, with the carried state It traced the true root cause on 5 of 5 undocumented findings that carried a clue in this run -- the free floor gets 0 of 7 by construction, every time.
You need alerting across reporting periods without re-raising the same open incident — the model WITH the carried state -- never the stateless variant Duplicate findings go from 0 of 102 quiet periods to 30 of 102 the moment the carried-state sentence is removed, at no reduction in cost per reading.
At a glanceHow the whole thing runs
100%status accuracy pct
2,382 msp50, end to end
$1.97per 1,000 CDE profiles · Google Gemini 3 Flash
Run once, for real, on 2026-08-24. Every figure on these pages was captured from that run — nothing is written from intent.
14 steps, grouped by the question that sends you to them rather than by build order. Each tile carries the one figure that step is about, and opens the page behind it.
Trace a bank's bad data back to its source14 steps · 4 questions · run once, for real · 2026-08-24
Every tile is a linkall 14 steps · no step without a page
Should you use this?What you bring, where it stops, and when not to use it
Before you commit an afternoon to this, these are the answers that decide it. Each one is rendered from the record it lives in — and links the page that holds it in full.
What do I have to bring?
Keep the eight section headings in src/segment.py::SECTIONS and supply your own data/gold.jsonl with one row per reading. The undocumented-upstream rate measured here (7 of 30 CDEs, about 23 pct, split 5-with-a-clue/2-without) is a property of THIS corpus, not a measured property of data governance in general.Corpus lens →
When is this the wrong choice?
Avoid: Do not conclude a model buys nothing for lineage tracing in general. The tie holds only where the registry itself is complete; this scenario is defined by that being true. That is the case against the best-fitting scenario (“Your lineage registry captures every hop system-to-system with no manual gaps”). 3 scenarios scored in all, each with its own.Eval lens →
Where does it stop working?
An incident open for more than the corpus's four consecutive reporting periods -- untested; the carried state's three scalars have never been exercised past that horizon. 5 recorded failure modes, each from a run rather than a guess.Corpus lens →
What was never verified?
WHETHER THE FREE FLOOR'S 100.00 PCT ON DOCUMENTED-ORIGIN ROOT CAUSES SURVIVES A REGISTRY WITH BRANCHING LINEAGE. This corpus's declared chains are a single linear sequence of exactly four hops; a registry where two upstream sources merge into one hop, or where a hop transforms rather than merely passes through a value, is not modelled, and the floor's 'earliest nonzero hop' rule has not been measured against either. 7 items this kit says it could not check.Eval lens →
Can I run this on a model I control?
Yes — any OpenAI-compatible endpoint, including one on your own hardware. The shipped adapter takes its host from BASE_URL and its model from MODEL, so nothing in src/ changes. The published figures come from 1 model on the fast tier, with the carried state, one provider, one key. Prompt lens →
And if it fits — what do I stand up?
4 artifacts with a stated home and a stated egress, and 4 decisions each with what you provision past its ceiling — plus what was not measured. That is the next page, not this one.step 14 — Run it in your environment →
Not asked of this kit — 2 questions: clone (a fresh clone of this kit runs with nothing fetched); judge (nothing here is graded by a model).
Last verified 2026-08-24 — r001-dq-lineage. Every figure on these pages was captured from that run.
Run itHow this reaches your data
Every result on this page was produced by pure code over checked-in files, with no API key — which is why you can read the numbers before anyone spends anything.
Run this on your own data
The pipeline, its eval harness and the runs behind every numberdeployed inside your environment, on your own model endpoints, against your own documents.
The corpus above is the shape, not the limitit is a folder swap, and there is no database to migrate.
Checked before this shipped — A fresh clone with no API_KEY renders the full UI (python3 -m src.app), the committed corpus, the answer key and the free floor's verdict on every reading -- all computed locally. It reproduces r001-dq-lineage's committed results via the 'Show what run r001 recorded' replay button, but cannot make a new live call: the read button returns a plain sentence saying nothing was called, rather than an error.
PresenterOpens the private repo. Visible to admins only.
Step 01 of 14Business case
Written for: product manager · Measured during the eval run. Never estimated, never quoted from a vendor page.
In brief
100.0%rows answered
2,382 msp50, end to end
6,019 msp95
1 minclone to first result
What the clock covers. END-TO-END per reading: one HTTP request carrying the assembled prompt -- the five quality/lineage rules, the carried-state sentence, and this period's CDE definition, profile, lineage registry, reporting position and steward notes -- and the reply parsed to a status, an affected segment, a root-cause system and a new-finding call. Parsing the extract into sections, dropping the withheld Escalation Contact section, and advancing the carried state all happen outside this measurement and cost no network at all.
Current processWhat it replaces
The manual walk from a failing-rate dashboard to a lineage registry to a steward's notes, repeated every reporting period for every CDE, to decide whether this period is a new finding, a continuing one, a closed one, or nothing at all.
Where it is not good enough
⚑ THE MODEL CANNOT FIND A ROOT CAUSE THAT EXISTS NOWHERE IN THE FILE, AND THAT IS BY DESIGN RATHER THAN A DEFECT -- BUT IT MEANS THE TOOL HAS NO WAY TO TELL 'CONFIRMED NO UNDOCUMENTED STEP' APART FROM 'NOBODY HAS LOOKED YET'. Of the seven undocumented-upstream CDEs in this corpus, the model traced the true root cause on all five whose Steward Notes named the manual step in prose, and stopped one hop short -- same as the free floor -- on the two where the notes said only that the source had not been confirmed. A CDE whose true origin nobody has documented anywhere, in any system, will read as a normal, fully-traced finding pointing at the wrong system, with nothing on the page to say otherwise. ⚠︎ ROOT CAUSE IS GRADED BY NORMALISED TEXT MATCH, NOT EXACT STRING, because the undocumented step has no fixed proper name -- see evals/scoring.py, which also documents a real grading bug this caught on its own first pass. ⚠︎ ONE READING WAS CUT OFF AT THE 4,000-TOKEN CEILING in the stateless control run (CDE-0018-P4); the scored, stateful run hit no ceiling on any of its 120 readings, but the ceiling is not proven safe on a corpus with longer extracts or a heavier reasoning path. ⚠︎ THE CORPUS IS FOUR QUARTERLY PERIODS PER CDE -- an incident open longer than that, or a CDE re-breaching after remediation within the same run, is untested.
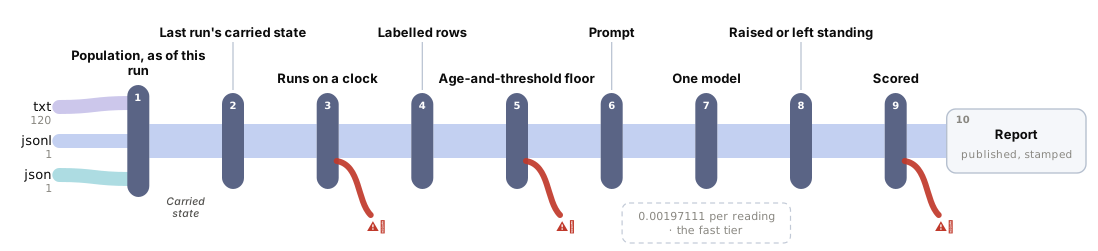
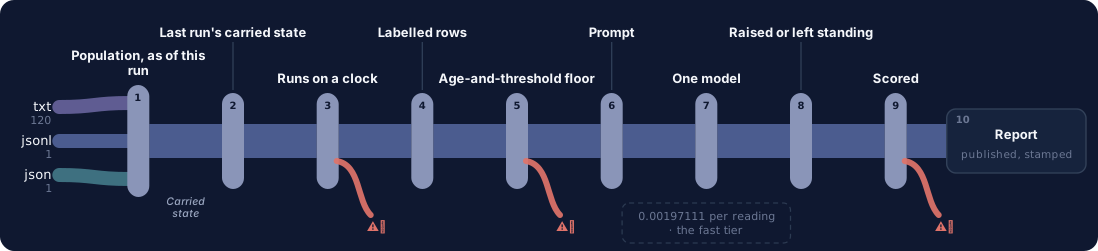
One question, end to end. Colour on the fan-in is the corpus format; a red hook marks every station with a recorded failure, and the words — every sub line, failure and report field — are in the ledger beneath. Every station is a link — click one to jump to its row, and each row links to the lens that explains it.
→Sources
txt120jsonl1json1
30 critical data elements, 120 readings across 4 quarterly reporting periods — every open CDE re-profiled whole, on a clock
status / segment / alert all 100.00% — ties the model on every structured field
root cause on undocumented origins: 0.00% (0 of 7), by construction, $0.00
Recorded failureTHE FLOOR CANNOT SEE PAST THE FIRST DECLARED LINEAGE HOP — it stops one hop short of the true origin on all 7 undocumented-origin findings, every time
root cause on undocumented origins split apart: clued vs unclued
Recorded failureroot cause on undocumented origins: 71.43% overall (5 of 7) — 100.00% (5 of 5) where the steward's notes name the step, 0.00% (0 of 2) where they do not
status / segment / alert: 100.00% — TIES the $0.00 free floor on every one
100.00%root cause, documented origins: — both arms
root cause, undocumented origins: 71.43% model vs 0.00% floor
stopped one hop short: 2 of 7 model (both no-clue cases) vs 7 of 7 floor
2026-08-24as of
It produces a finding for a data steward to act on — which CDE breached its declared threshold, which segment concentrates the failures, which system is the true root cause — and never writes back to a source system, corrects a record or files a remediation ticket; there is no setting that makes it. ⚑ TWO STATIONS MAKE THIS A MONITOR AND NEITHER IS THE MODEL. The carried state is three scalars written by src/state.py from the arithmetic, never from the model's reply — the stateless control makes its value concrete: status falls from 100.00 to 74.17 pct and duplicate findings rise from 0 of 102 to 30 of 102 quiet periods, purely from losing the one sentence that says an incident is already open. The clock is the second: every open CDE is re-profiled in full each quarter, and root-cause tracing is asked fresh on the period a breach first opens, carried forward — not re-derived — while it stays open. ⚑ THE HONEST HEADLINE LEADS RATHER THAN A MARKETING ONE. Status, affected segment and new-finding alerting all tie the $0.00 free floor at 100.00 pct — the floor is not a strawman, it reads the same structured page the model does.
⚠︎ THE SPLIT IS ENTIRELY ON THE ROW'S OWN OPEN ITEM: a lineage registry that only records system-to-system hops has no row for an undocumented, manual, analyst-only step, so a floor built on it stops one hop short of the true source on all 7 such findings, every time, by construction. The model traces the true origin on the 5 of 7 where a steward's own note names the step in prose, and matches the floor's shortfall on the 2 of 7 where no such evidence exists anywhere in the file — it does not invent a source it was never given.
The swap seams
Seam
File
What changes
the model
src/adapters/__init__.py
PROVIDER, BASE_URL, API_KEY and MODEL in .env. Adding a provider is one function and one entry in PROVIDERS; it must return token counts, because lens 05 publishes them and lens 07 prices them.
the carried state
src/state.py
What is carried between reporting periods, and how it is worded to the model. Three scalars today, rendered as English rather than JSON -- a design choice, not a measurement.
the CDE registry and quality rules
tools/build_corpus.py
The 30 CDE definitions, their thresholds, their declared lineage chains and which are flagged undocumented-upstream. A forker points this at their own registry by keeping the eight section headings and supplying their own data/gold.jsonl.
the free floor
evals/baseline.py
How aggressively the declared registry is read. This floor is the STRONGEST free reading of structured metadata alone; a forker with richer lineage tooling could raise this floor's ceiling on the documented cases.
Components
Component
File
Role
the corpus generator
tools/build_corpus.py
Generates 30 CDEs x 4 quarterly reporting periods = 120 extracts from a fixed seed (SEED = 20260824). The 7 undocumented-upstream CDEs are drawn from across three breach-pattern groups rather than concentrated in one, so the property is not separable by owning function or breach shape. The gold labels are src/dqstep.step's output over the planted breach plan, never typed.
the quality/lineage arithmetic
src/dqstep.py
The four-stage rule as pure code: breach-vs-threshold, the once-per-incident finding rule, and root-cause carry-forward while an incident stays open. No model, no judgement.
the carried state
src/state.py
SEAM -- the thing that makes this a monitor. Three scalars per CDE (incident_open, the root_cause_system last identified, the previous status), written from the arithmetic and never from the model's reply, rendered into one or two English sentences for the prompt.
the section splitter
src/segment.py
Splits an extract into its eight named sections. Pure code; evals/check_labels.py asserts all eight are present in all 120 documents before a run may spend.
the section selector
src/select.py
Decides which sections reach the model. Escalation Contact -- the data steward's name, mobile and email -- is mapped by no field and is subtracted unconditionally. Steward Notes ARE sent deliberately: they are the kit's only channel for an undocumented lineage step.
the prompt
src/prompt.py
Three parts: the fixed instruction, the carried-state sentence, and the selected sections in document order. The stateless build replaces the sentence with a line saying no history is available.
the model adapter
src/adapters/__init__.py
SEAM -- the model. Raw HTTP for every provider, standard library only, shared unmodified with every sibling kit in this repo.
the watch
src/watch.py
One CDE, one reporting period, one call. Parses the measured rate, threshold and structured profile fields off the page with a regex and parses NOTHING from the Lineage Registry or Steward Notes -- deciding the root cause from those is the entire task.
the local UI
src/app.py
One CDE, one reporting period, its carried state and its verdict, on 127.0.0.1:8203. Shows the model's answer beside the free floor's, and an undocumented-step banner explaining what agreement or disagreement between the two columns means.
the free floor
evals/baseline.py
Rule-based lineage matching against DECLARED, system-to-system metadata only -- $0.00, no model. Reads the Reporting Period Profile and Lineage Registry with regex, independently of src/dqstep.py, and NEVER reads Steward Notes.
the scorer
evals/scoring.py
Exact match on status, affected segment and new-finding alert; a normalised token-overlap match on the free-text root cause, split into three outcomes. Documents a real grading bug it caught on its own first pass before publishing.
Where it breaks at scale
THE REPORTING CADENCE IS THE SCALING VARIABLE, AND IT IS ALSO WHAT MAKES THE CARRIED STATE MATTER. One run of this watch is one call per OPEN CDE, every reporting period, whether or not anything changed -- a registry of 2,000 CDEs on a quarterly cadence is 8,000 calls a year; the same registry monitored monthly is 24,000. THE CORPUS TESTS EXACTLY FOUR CONSECUTIVE PERIODS PER CDE. An incident that stays open longer than four periods, a CDE that re-breaches shortly after remediation within the same run, or two incidents open on the same CDE at once (this kit's carried state holds ONE root_cause_system, not a list) are all untested. ROOT-CAUSE TRACING READS EXACTLY ONE STEWARD NOTE PER PERIOD. A real deployment accumulates a THREAD of notes across periods, sometimes correcting an earlier finding; this kit's carried state remembers the root cause a finding settled on, never the note that produced it. THE FREE FLOOR'S CEILING ON DOCUMENTED CASES IS A PROPERTY OF THIS CORPUS'S LINEAGE DEPTH (four hops, one exception count per hop). A registry with branching lineage or transformation logic between hops is not modelled here.
PresenterOpens the private repo. Visible to admins only.
Step 03 of 14App UI
Written for: anyone, in 5 seconds · Screenshots of the running app taken during the run.
SuccessesWhen it works
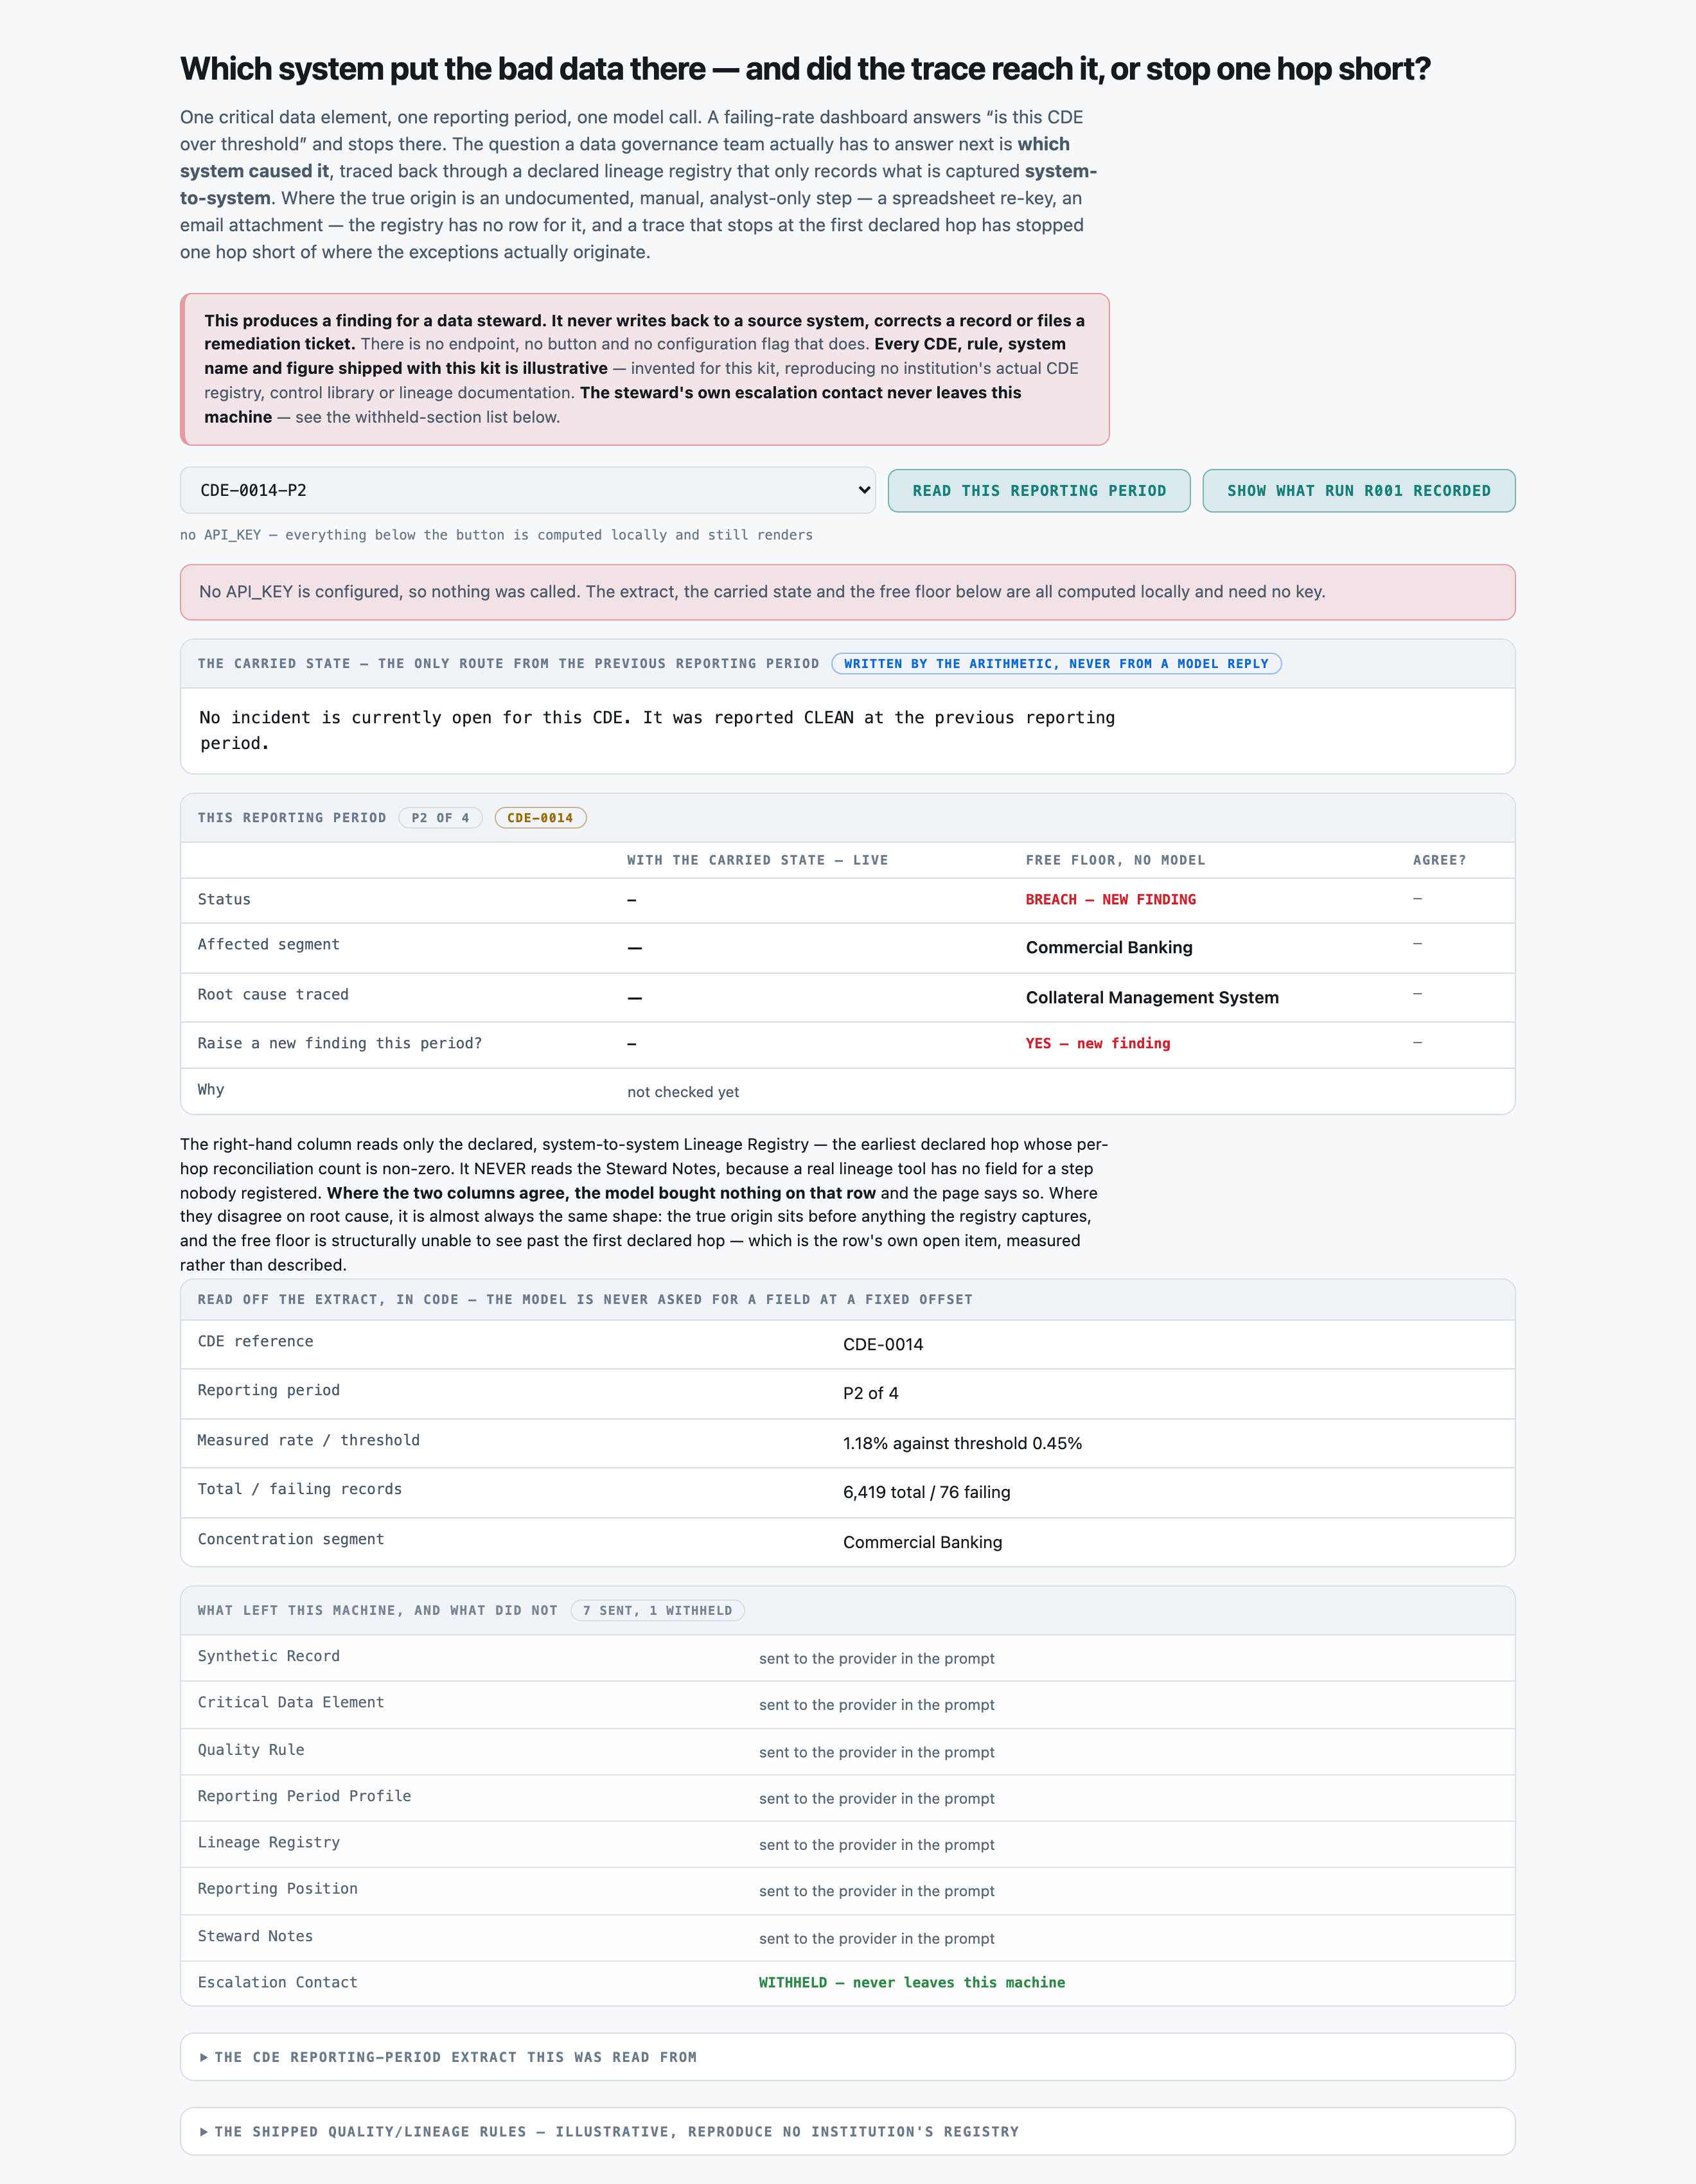
No API_KEY configured. The extract, the carried state and the free floor still render locally and need no key -- the free floor already shows the failure mode this kit measures: it names 'Collateral Management System', the first declared lineage hop, for a CDE whose true root cause is an undocumented manual step the registry never captured.successOpen full size →A live call on CDE-0014-P2. The model answers 'Manual reconciliation of third-party vendor file (undocumented analyst step before Hop 1 into Collateral Management System)' -- correctly reading the Steward Notes for the step the Lineage Registry does not carry, where the free floor stops at the first declared hop.successOpen full size →The same reading, replayed from the committed run r001-dq-lineage rather than a live call -- the model's answer matches what was actually scored, not a cherry-picked re-run.successOpen full size →
LimitsWhen it does not
A report showing only wins is an advert. This one is required, and the validator now refuses a kit that omits it.
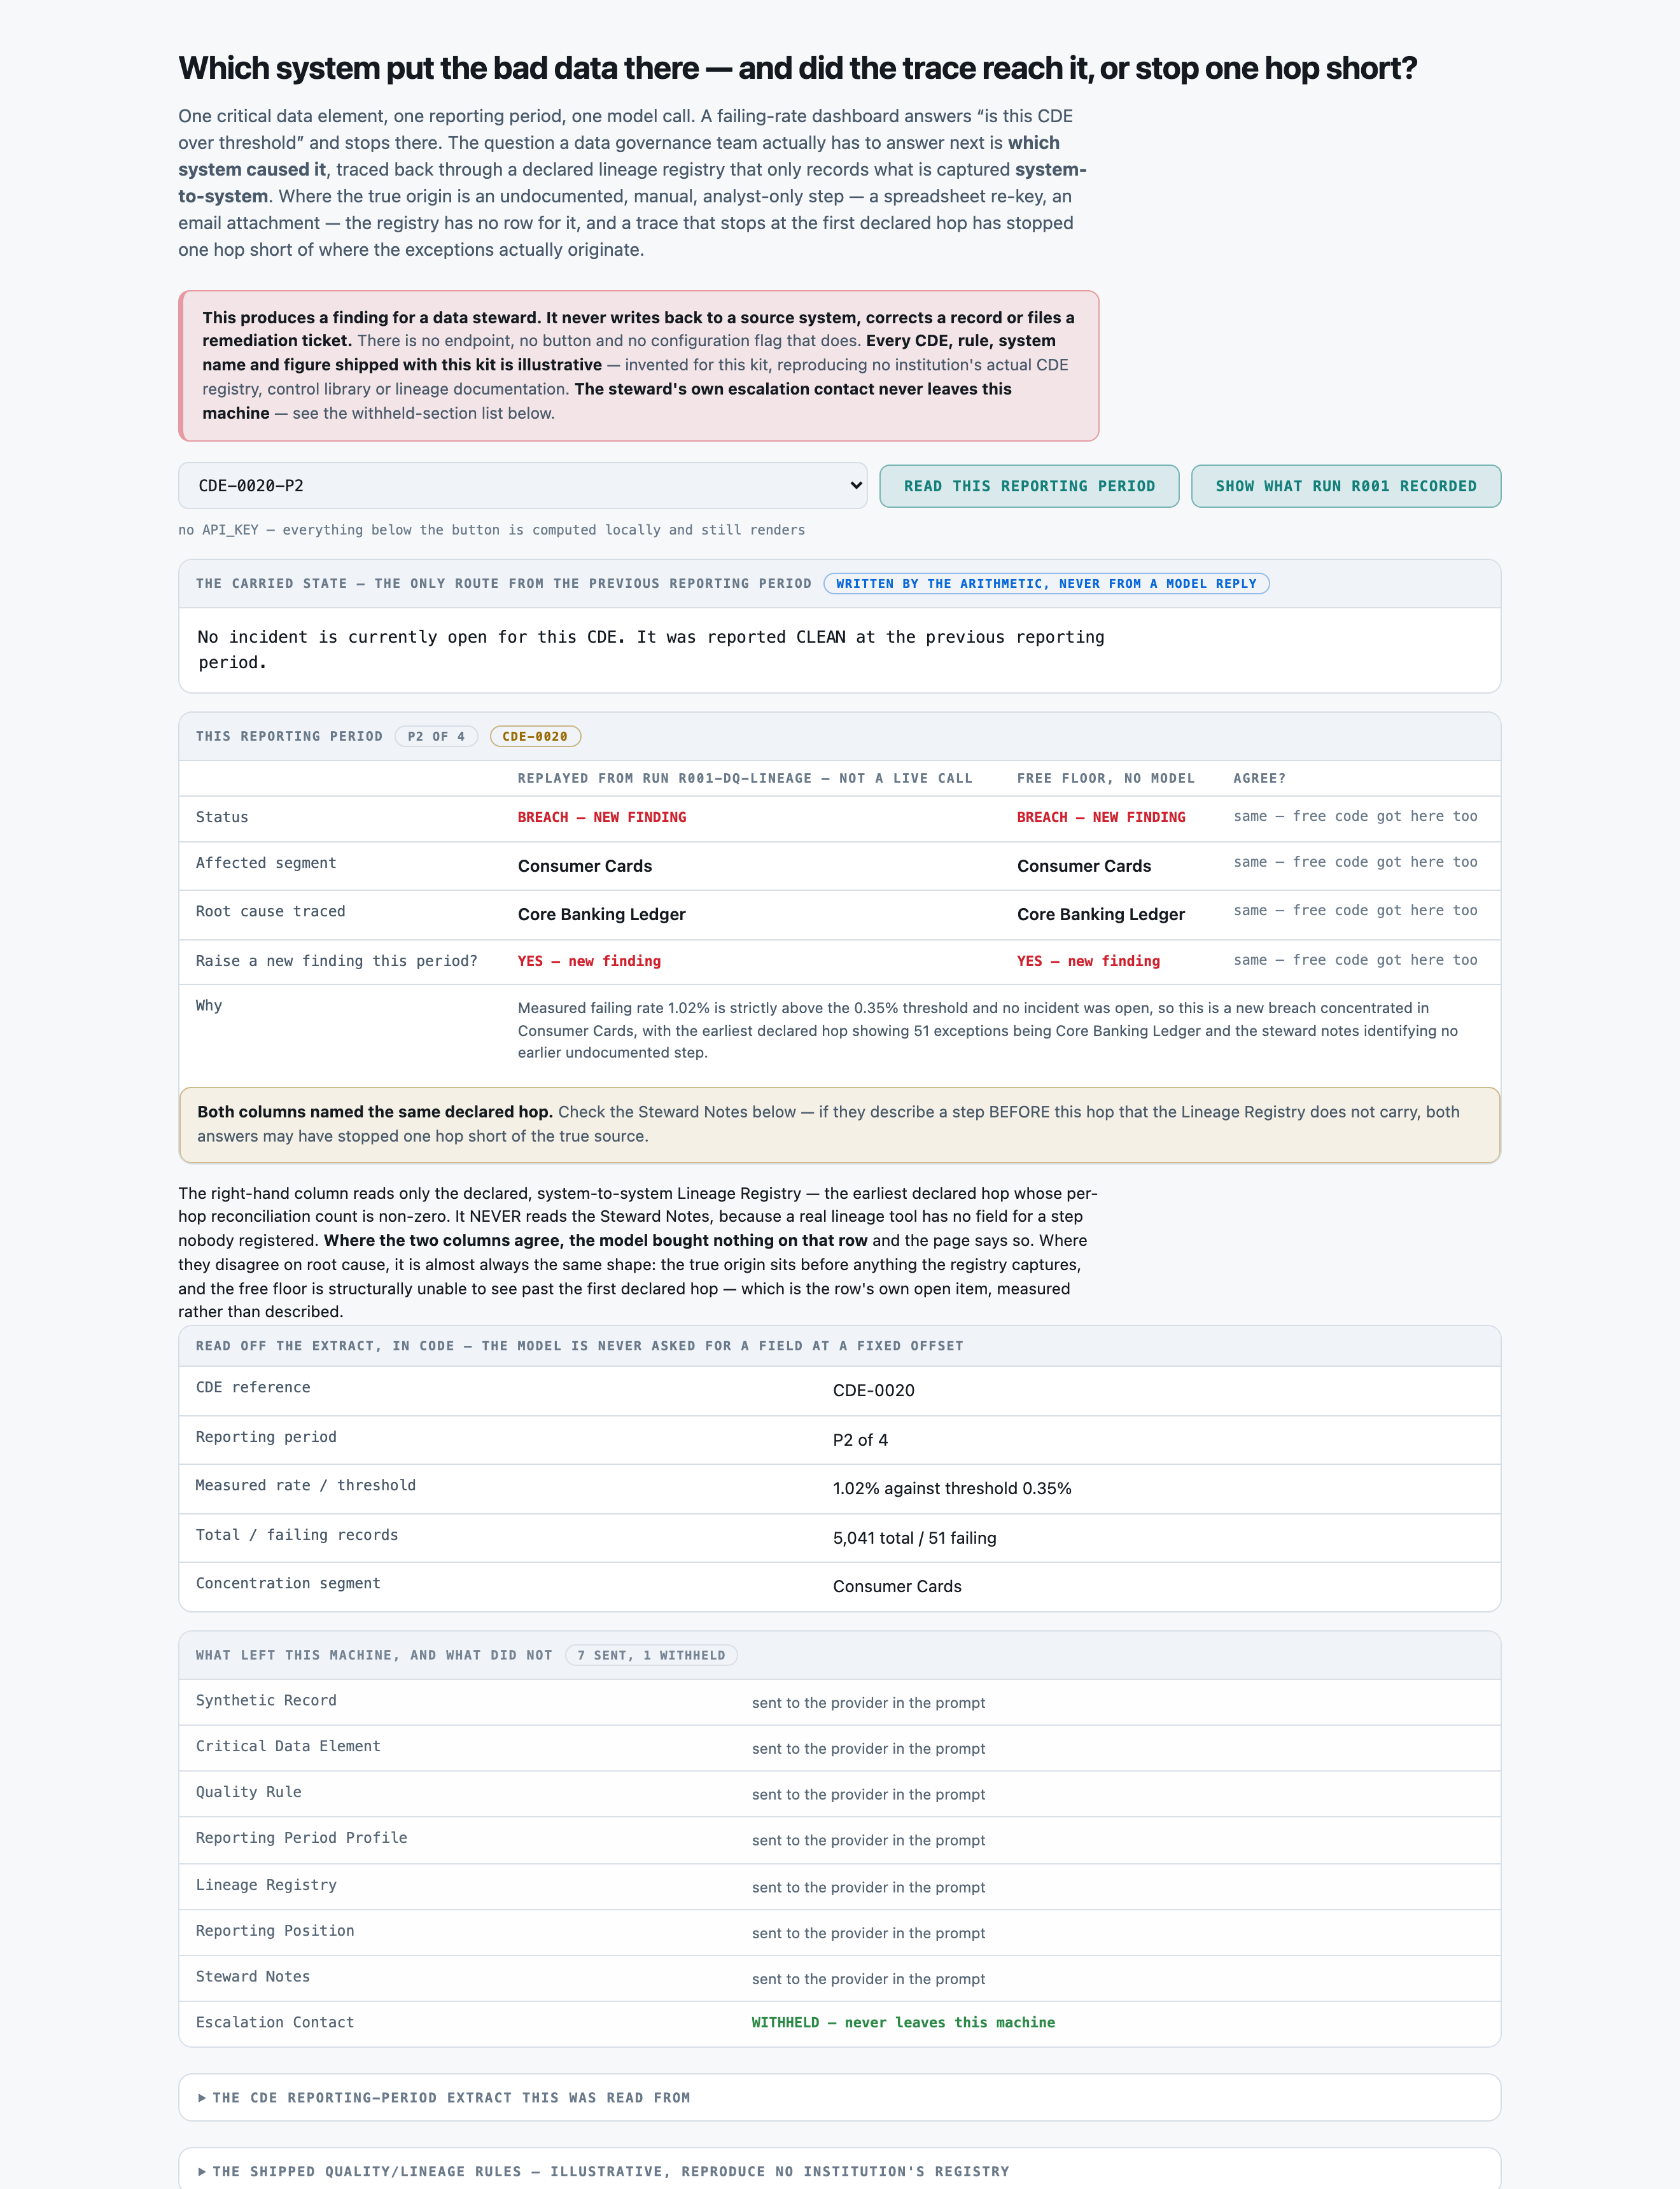
CDE-0020-P2, replayed from run r001. Both the model and the free floor answer 'Core Banking Ledger' -- the first declared hop -- because the Steward Notes here say only that the source has not been confirmed beyond the recorded pipeline. This is one of the two undocumented-origin findings the model does NOT trace correctly: it has no evidence to find, and it does not invent one. Stopped one hop short, same as the $0.00 floor.failureOpen full size →
PresenterOpens the private repo. Visible to admins only.
Step 04 of 14Corpus
Written for: "can I point this at mine?" · Measured off the corpus the run actually used.
In brief
120CDE profiles
0.54 MiBjson 1 · jsonl 1 · txt 120
p50 4,617chars per CDE reporting-period extract
$0.00setup · 0.3s
How it is cutWhat one CDE reporting-period extract is
30 CDEs x 4 fixed quarterly reporting periods each (2025-03-31 / 06-30 / 09-30 / 12-31) -- no train/test split; every reading is scored against the generator's own answer key
SetupWhat the setup figure measured
There is no index to build -- every reading re-profiles the CDE's own extract whole, with no retrieval step. build_seconds/build_cost_usd measure tools/build_corpus.py generating all 120 extracts plus data/gold.jsonl and data/corpus-stats.json from the fixed seed, not an embedding or retrieval index.
LicenceLicence
MIT, same as the rest of adhana-ai/adhana-foundry-kits
Bring your ownBring your own CDE profiles
Keep the eight section headings in src/segment.py::SECTIONS and supply your own data/gold.jsonl with one row per reading. evals/check_labels.py re-derives every status from src/dqstep.step and refuses to let a run spend if the hand-written key disagrees with the arithmetic. tools/build_corpus.py is the reference generator to adapt: CDE_DEFS is the registry, make_lineage() the declared-hop pool, and breach_pattern() the per-CDE status plan.
⚠︎ And what stops being true when you do: The undocumented-upstream rate measured here (7 of 30 CDEs, about 23 pct, split 5-with-a-clue/2-without) is a property of THIS corpus, not a measured property of data governance in general. A real institution's own coverage gap between what its lineage tooling captures and where its data quality issues actually originate is unknown until someone goes and looks for it.
What breaks it
An incident open for more than the corpus's four consecutive reporting periods -- untested; the carried state's three scalars have never been exercised past that horizon.
Two data-quality incidents open on the same CDE at once -- src/state.py carries ONE root_cause_system, not a list, so a second concurrent incident has nowhere to be recorded.
Branching lineage (two upstream sources merging into one declared hop) or a transformation step between hops -- the corpus's lineage is a single linear chain of exactly four hops.
An undocumented step where NO steward note exists anywhere and none will ever be written -- the two no-clue cells in this corpus (CDE-0020-P2, CDE-0025-P1) are exactly this case, and both the model and the free floor stop one hop short on both.
A reporting cadence other than quarterly, or a lineage registry deeper or shallower than four hops -- both are corpus properties, not measured properties of the task.
PresenterOpens the private repo. Visible to admins only.
Step 05 of 14Prompt
Written for: engineer · Logged from the run, verbatim.
In brief
The assembled prompt in full, and its real decomposition. Every part below occurs in the prompt that was actually sent. The split is in characters, because that is what this run recorded — the billed totals are measured, but nothing apportioned them across the parts, and dividing a measured total by character share would produce three numbers nobody counted.
AssemblyHow the prompt is assembled
Part
Characters
Tokens
system
194
not measured
the question
3,108
not measured
Carried state
278
not measured
CDE reporting-period extract
4,478
not measured
Total
1,860
This is the cost lesson as arithmetic: of the 8,058 characters assembled, 4,478 are contexts — 56% of the prompt, the largest single part. A per-request bill follows whichever part is biggest, and on this kit that is the one named here.
The exact prompt sent for CDE-0001-P1, reconstructed by replaying src/prompt.build() with this reading's own recorded carried-state input (data/gold.jsonl's carried_in) -- trustworthy because the reconstructed length (7,868 characters) and section list match what evals/run.py's harness logged for the run's first completed call.
Full promptThe prompt in full
The verbatim prompt, as sent
the prompt, as sent
You are a scheduled data-quality and lineage watch for one bank's critical-data-element registry. You read one CDE at one reporting period, and you answer with one JSON object and no other text.

You are the scheduled data-quality and lineage watch for one bank's critical-data-element (CDE)
registry. It runs every reporting period and re-profiles EVERY CDE against its declared quality
rule. You are reading ONE CDE at ONE reporting period.

The CDE's definition, its quality rule, this period's profiling results, its declared lineage
registry and the steward's notes are reproduced in the extract below. You cannot see the earlier
reporting periods; what is known about them is stated under "Carried state" and is the only history
available to you. Do not assume anything about earlier periods beyond it.

How to work it out:
 - FIRST decide the STATUS for this period, applying Rule DQ-1 (breach = measured rate strictly
   over threshold) and the carried state:
     CLEAN            not in breach, and no incident was already open
     BREACH_NEW       in breach, and no incident was already open -- this is a NEW finding
     BREACH_ONGOING   in breach (or not yet remediated), and an incident was ALREADY open
     REMEDIATED       not in breach this period AND a remediation is recorded for the open
                      incident (Rule DQ-4) -- being within threshold alone is not remediation
 - THEN, only for BREACH_NEW: name the AFFECTED SEGMENT the Reporting Period Profile identifies as
   carrying the concentration of failing records. For CLEAN and REMEDIATED, this is "none".
   For BREACH_ONGOING, restate the segment named when the incident was first raised, from the
   carried state or this period's profile if it repeats it.
 - THEN, only for BREACH_NEW: trace the ROOT CAUSE. Read the Lineage Registry: it lists hops from
   the most upstream system to the report, each with a per-hop reconciliation exception count for
   this period. Rule DQ-5: the root cause is the EARLIEST (most upstream) hop with a non-zero
   exception count. BUT the Lineage Registry only records what is captured system-to-system --
   check the Steward Notes for any mention of a step BEFORE the first declared hop (an undocumented,
   manual, analyst-only step). If the notes name such a step and say the exceptions originate
   there, THAT step is the true root cause, even though it is not in the Lineage Registry table.
   Naming the first declared hop when the notes point further upstream has stopped one hop short.
   For BREACH_ONGOING, restate the root cause already identified (carried state) unless this
   period's Lineage Registry or Steward Notes name a superseding instrument (Rule DQ-3). For CLEAN
   and REMEDIATED, this is "n/a".
 - THEN decide "new_alert": YES only when status is BREACH_NEW -- a finding is raised once per
   incident (Rule DQ-2). NO for CLEAN, BREACH_ONGOING and REMEDIATED.

Answer with a single JSON object and nothing else:

{"status": "CLEAN|BREACH_NEW|BREACH_ONGOING|REMEDIATED",
 "affected_segment": "<segment name, or 'none'>",
 "root_cause_system": "<system or step name, or 'n/a'>",
 "new_alert": "YES|NO",
 "rationale": "one sentence, naming the measured rate against the threshold and, where a root "
              "cause was traced, which hop and why"}

Carried state
----------------------------------------------------------------
No earlier reporting period has been recorded for this critical data element. This is its first appearance on the watch: no incident is open and no root cause has been identified for it before today.

CDE reporting-period extract
----------------------------------------------------------------
Synthetic Record
----------------------------------------------------------------
This is a SYNTHETIC data-governance monitoring record generated for the dq-lineage kit. No real bank, customer, system or person is represented.
CDE reference: CDE-0001   Reporting period: P1 of 4

Critical Data Element
----------------------------------------------------------------
CDE reference           : CDE-0001
Name                    : Days Past Due (Retail Loans)
Owning function         : Credit Risk
Quality dimension       : Accuracy
Definition              : The number of calendar days a retail loan's scheduled payment is overdue, as reported to the risk data mart at each reporting period.

Quality Rule
----------------------------------------------------------------
Failing definition      : A record fails where a record where Days Past Due as reported disagrees with the value recomputed from the servicing ledger by more than 1 day.
Declared threshold      : 0.75%

Rule DQ-1  A CDE is IN BREACH for a reporting period when its measured failing rate for that
          period is STRICTLY GREATER than its declared threshold. Equal to the threshold is
          within tolerance, not a breach.
Rule DQ-2  A finding is raised ONCE per incident, on the first reporting period at which the CDE
          is in breach with no incident already open. A later period that is still in breach
          reports the incident CONTINUING; it does not raise a second finding for the same
          incident (BREACH_ONGOING).
Rule DQ-3  The root cause identified when a finding is raised STANDS for every later period the
          same incident remains open, unless a new instrument in THIS period's Lineage Registry
          supersedes it. It is not re-derived from scratch each period.
Rule DQ-4  An incident is REMEDIATED only on the period at which BOTH conditions hold: the
          measured rate is back within threshold, AND a remediation is recorded in this period's
          Prior Period Status carry-forward or this period's own record. Passing the threshold
          with no remediation recorded is not evidence the issue was fixed -- it is evidence the
          sample happened to be clean this period, and Rule DQ-2's incident stays open.
Rule DQ-5  Root cause is traced from the DECLARED lineage registry: the earliest (most upstream)
          hop at which this period's per-hop reconciliation exceptions are non-zero. Where the
          Steward Notes name an earlier step not carried in the Lineage Registry -- an
          undocumented, manual, system-to-system gap -- and that step is where the exceptions
          actually originate, THAT step is the true root cause, not the first declared hop
          downstream of it. A trace that stops at the first declared hop when the notes say the
          gap sits before it has stopped one hop short.

Reporting Period Profile
----------------------------------------------------------------
Reporting period        : P1 of 4
Snapshot date           : 2025-03-31
Previous period         : --
Next period             : 2025-06-30
Total records profiled  : 47,837
Failing records         : 182
Measured failing rate   : 0.38%
Declared threshold      : 0.75%
Segment breakdown (failing records): no material concentration this period
Concentration segment    : none

Lineage Registry
----------------------------------------------------------------
Declared hops, most upstream first. Exceptions are this period's per-hop reconciliation count against the prior hop.
  Hop 1  Deposit Servicing System         (owner: Business Ops            ) exceptions: 0
  Hop 2  Data Quality Firewall            (owner: Data Engineering        ) exceptions: 0
  Hop 3  Finance Data Mart                (owner: Data Engineering        ) exceptions: 0
  Hop 4  Regulatory Reporting Mart        (owner: Reporting & Analytics   ) exceptions: 0

No remediation instrument recorded against this CDE's lineage this period.

Reporting Position
----------------------------------------------------------------
Reporting period        : P1 of 4
Watch cadence           : quarterly, on the last calendar day of the quarter
Snapshot date           : 2025-03-31
Previous period         : --
Next period             : 2025-06-30

Steward Notes
----------------------------------------------------------------
No open findings for this CDE this period.
Raw responseThe raw response
The raw response, before any parsing
the response, unparsed
{"status": "CLEAN", "affected_segment": "none", "root_cause_system": "n/a", "new_alert": "NO", "rationale": "Measured failing rate of 0.38% is not strictly greater than the 0.75% threshold, and no incident was previously open, so the CDE is clean."}
PresenterOpens the private repo. Visible to admins only.
Step 06 of 14Evals
Written for: the skeptic · The harness output, with as_of / model version / dataset version / verified_by.
In brief
Trace a bank's bad data back to its source — 120 CDE profiles. One model answered, and every answer was then graded Two different ways — because the grade is a measurement too, and most of what went wrong on this kit went wrong in the ruler rather than the model.
The rulerHow it was graded
Every gold value is computed by tools/build_corpus.py's planted breach plan and re-derived independently by src/dqstep.step in evals/check_labels.py before any run may spend. There is no LLM judge anywhere in this kit's grading path: status, affected segment and new-finding alert are exact string matches against a closed list, and root cause is a normalised token-overlap or keyword-recognition match implemented in pure Python (evals/scoring.py).
120CDE profiles
120source documents
1model tier
2grading methods
MeasurementsWhat was measured
COUNTED120 · 88 / 120status accuracy pct — readings, four-way status (CLEAN / BREACH_NEW / BREACH_ONGOING / REMEDIATED)Decided by == against a fixed gold value. No model graded this and it reproduces to the digit — which makes it checkable, not necessarily right: it is only as good as the gold behind it.
COUNTED120 · 118 / 120affected segment accuracy pct — readingsDecided by == against a fixed gold value. No model graded this and it reproduces to the digit — which makes it checkable, not necessarily right: it is only as good as the gold behind it.
COUNTED120 · 89 / 120new alert accuracy pct — readings -- no missed and no duplicate findingsDecided by == against a fixed gold value. No model graded this and it reproduces to the digit — which makes it checkable, not necessarily right: it is only as good as the gold behind it.
COUNTED16 · 16 / 18root cause correct pct — BREACH_NEW findings -- the periods a root cause is actually tracedDecided by == against a fixed gold value. No model graded this and it reproduces to the digit — which makes it checkable, not necessarily right: it is only as good as the gold behind it.
COUNTED11 · 11 / 11root cause documented correct pct — findings whose true root cause is a row in the declared Lineage RegistryDecided by == against a fixed gold value. No model graded this and it reproduces to the digit — which makes it checkable, not necessarily right: it is only as good as the gold behind it.
COUNTED5 · 5 / 7root cause undocumented correct pct — findings whose true root cause is an undocumented, manual step the registry never captured -- the row's own open itemDecided by == against a fixed gold value. No model graded this and it reproduces to the digit — which makes it checkable, not necessarily right: it is only as good as the gold behind it.
NOT YET KNOWN—A person confirmed the gold is rightThe grader is == and needs no confirming. The gold does: it is machine-derived from the registry's structured modules, and every rate on this page rests on that derivation being faithful to what the prose actually says. Nobody has read a document against its gold record by hand.
Two words carry this page: Counted is deterministic and nobody's opinion and Not yet known is printed blank rather than filled with something plausible. There is no Judged row here and that is the point: nothing on this page is a model's opinion about another model. The row most worth having is currently the empty one.
How the method was validated
The METHOD is validated by construction and the construction is asserted: evals/check_labels.py replays all 30 CDE chains through src/dqstep.step and refuses to let a run spend if any of the 120 rows disagrees with the committed key. It also asserts the corpus carries both a clued and an unclued undocumented-origin case in quantity, so the split this kit's headline depends on is corpus-guaranteed rather than a lucky draw.
347.06output tokens · the fast tier, with the carried state · 2,382 ms p50
379.12output tokens · the same tier, memory removed (the control) · 2,192 ms p50
Two tiers, one API key
Not two vendors and not a vendor comparison — which is the whole reason the two-model rule could be met without signing up to a second provider. Both tiers send the same retrieved context; the slower one writes about twice as much back, waits 0.9× as long, and lands one row apart on 120. This set does not separate them on quality and no ranking should be read from it — which is not an opinion about the models but something the second run below demonstrated.
Grading costWhat it costs
Every dollar on these pages is a MEASURED token count multiplied by a named vendor's PUBLISHED rate -- a projection onto a rate card, not a bill anyone paid.
Priced at
Per 1M in / out
One CDE profile
1,000 CDE profiles
Share that is the prompt
Google Gemini 3 Flash the shared card every kit in this series projects onto, so the rows compare across use cases rather than across price lists
$0.50 / $3.00
$0.001971
$1.97
47%
OpenAI GPT-5.6 Luna the cheapest row on the published set, for the low end of the range
$0.20 / $1.20
$0.000788
$0.79
47%
Anthropic Claude Fable 5 a frontier tier, for the other end of the range
$10.00 / $50.00
$0.035952
$35.95
52%
Same work, 46× the bill
The same CDE profiles, the same tokens — only the rate card changed. And across all 3 cards between 47% and 52% of what you pay is the prompt this pipeline sends, not the answer it writes.
THE CADENCE. It is the only knob that moves the bill by a whole multiple. Slowing it does not cost accuracy on the fields this run measured the same way critical-date's cadence trade costs missed windows, because nothing here is measuring a deadline -- but it does widen how long an open incident goes unremediated between readings, which Eval.could_not_verify already flags as untested past four periods.
Rates checked 2026-08-18. The provider that actually ran all 241 calls for this kit's build is kept out of these tables per this estate's naming rule, so nothing here is what was paid. The real spend is on the shared call ledger, not on this page.
The gradersTwo ways to grade
The free floor ties the model exactly on every structured field (status, affected segment, new-finding alert, all 100.00 pct) and on the 11 documented-origin root causes (100.00 pct each). It is not a strawman -- it reads the same Reporting Period Profile and Lineage Registry the model does, in pure Python, and carries the same three-scalar state between periods. The entire measured difference is on the 7 undocumented-origin root causes: the floor is 0.00 pct, stopping one hop short every time by construction, because it never reads Steward Notes; the model is 71.43 pct, splitting cleanly into 5 of 5 correct where the notes carry a clue and 0 of 2 where they do not.
the fast tier, with the carried state 100.0% status accuracy · the same tier, memory removed (the control) 74.2% status accuracy · the free floor, declared-registry lineage only 100.0% status accuracy · 2 more measured on each run
the fast tier, with the carried state 88.9% root cause correct · the same tier, memory removed (the control) 88.9% root cause correct · the free floor, declared-registry lineage only 61.1% root cause correct · 3 more measured on each run
Every row opens its own page: how the test was run, the input on one real row, the prompt or formula with every iteration of it, and the analysis.
Why this set cannot separate them
This labelled set CAN tell the arms apart on the column that matters, and cannot on the columns that do not -- both are informative. Status, affected segment and new-finding alert are a DEAD TIE at 100.00 pct across the model and the $0.00 free floor: the structured half of the task does not separate them, and the page says so rather than manufacturing a difference. Root cause on the 7 undocumented-origin findings is a 71.43-point spread (71.43 pct model, 0.00 pct floor) -- the sharpest separation on this board, and it lands exactly on the row's own stated open item rather than on an incidental field. The stateless control is the second-sharpest separation: status falls 25.83 points and duplicate alerts rise from 0 to 30 of 102, from removing one sentence and nothing else.
Choosing oneWhich one to use
The comparison is only useful if it ends in a choice. The answer is conditional — and it is not the grader with the best agreement score.
If your situation is
Use
Because
And avoid
Your lineage registry captures every hop system-to-system with no manual gaps
the free floor in this repo, or an equivalent rules engine over your own registry
It ties the model exactly on all three structured fields and on the 11 documented-origin root causes in this run -- 100.00 pct, $0.00, no key.
Do not conclude a model buys nothing for lineage tracing in general. The tie holds only where the registry itself is complete; this scenario is defined by that being true.
Your registry has known or suspected undocumented manual steps, and stewards write investigation notes when they find one
the model, with the carried state
It traced the true root cause on 5 of 5 undocumented findings that carried a clue in this run -- the free floor gets 0 of 7 by construction, every time.
Do not expect it to find a source nobody has written down anywhere. On the 2 of 7 with no clue in the notes, the model matched the free floor exactly rather than inventing an answer -- that is the honest outcome, not a partial win.
You need alerting across reporting periods without re-raising the same open incident
the model WITH the carried state -- never the stateless variant
Duplicate findings go from 0 of 102 quiet periods to 30 of 102 the moment the carried-state sentence is removed, at no reduction in cost per reading.
Do not run this kit's prompt stateless in anything resembling production; the stateless arm exists here only as a measured control.
This pipeline was also attacked, which is a different question from whether its answers are right: see Threat model for the injection experiment, its two gates and what it does not prove.
Failure causesHow it fails
Cause
What it means
Rows
A real example
one_hop_short
Named the first declared lineage hop when the true origin sits before it (scored run r001)
2
CDE-0020-P2, scored run r001: both the model and the free floor answer 'Core Banking Ledger' -- the first declared hop -- while the true origin is an undocumented manual step the Steward Notes do not name (they say only that the source has not been confirmed…
duplicate_alert
Re-raised a finding as NEW on an already-open incident -- measured ONLY in the memory-ablation control (s001), zero occurrences in the scored run r001
30
The stateless control reports new_alert YES on a CDE already carrying an open BREACH_ONGOING incident, because the carried-state sentence that says an incident already stands has been replaced with 'no history is available'. This is the deliberate experiment…
What we could NOT verify
WHETHER THE FREE FLOOR'S 100.00 PCT ON DOCUMENTED-ORIGIN ROOT CAUSES SURVIVES A REGISTRY WITH BRANCHING LINEAGE. This corpus's declared chains are a single linear sequence of exactly four hops; a registry where two upstream sources merge into one hop, or where a hop transforms rather than merely passes through a value, is not modelled, and the floor's 'earliest nonzero hop' rule has not been measured against either.
WHETHER THE MODEL'S 5-OF-5 CLUE-RECOGNITION RATE HOLDS ON A LARGER OR DIFFERENTLY-WORDED SAMPLE. Five is a small denominator, and this corpus's seven undocumented-step note templates were written by the same author who wrote evals/scoring.py's keyword-based recognition test -- the result may partly reflect vocabulary overlap between the two rather than pure reasoning over an independently-authored steward's note. Untested against real prose.
WHETHER DISABLING PROVIDER-SIDE REASONING (thinking) WOULD HOLD ACCURACY WHILE CUTTING COST. 75.2 pct of r001's output tokens (31,318 of 41,647) were reasoning left at the default; thinking was never sent on any published run.
ONE RUN PER ARM. Whether the tie on status/segment/alert (all exactly 100.00 pct for both the model and the floor) is stable across repeats, or whether the undocumented split (5 of 5 clued, 0 of 2 unclued) reproduces on a re-fired identical run, is not measured.
WHETHER THE CARRIED STATE IS BETTER RENDERED AS ENGLISH SENTENCES OR AS STRUCTURED JSON. src/state.describe writes prose; the obvious experiment costs one more 120-call run and has not been paid for.
WHAT A REAL INSTITUTION'S UNDOCUMENTED-LINEAGE RATE ACTUALLY IS. This corpus's 7-of-30 (about 23 pct) is invented by the generator, not measured from any real CDE registry -- see Data.bring_your_own_boundary.
WHETHER AN INCIDENT OPEN LONGER THAN FOUR CONSECUTIVE REPORTING PERIODS, OR A CDE WITH TWO CONCURRENT OPEN INCIDENTS, IS HANDLED SENSIBLY. Neither is exercised by this corpus, and src/state.py's carried state has no field for a second concurrent root cause.
PresenterOpens the private repo. Visible to admins only.
Step 07 of 14Unit cost
Written for: whoever signs off on the bill · Measured over the eval run, per model. Never quoted from a vendor page.
In brief
Tier
Input tokens
Output tokens
p50 latency
Google Gemini 3 Flash
OpenAI GPT-5.6 Luna
Anthropic Claude Fable 5
the fast tier, with the carried state
1,859.87
347.06
2,382 ms
$0.001971
$0.000788
$0.035952
the same tier, memory removed (the control)
1,829.52
379.12
2,192 ms
$0.002052
$0.000821
$0.037251
The token counts are measured on a real run and belong to this pipeline — which sections are selected, the field schema, the prompt — so they hold wherever you run it. The dollars are those counts multiplied by each vendor's published rate, checked 2026-08-18. Nobody paid these particular bills; they are what the same work would cost you on a card you can sign up to today.
Identical work in both rows — the same reading (one CDE, at one reporting period), the same tokens. Only the price list changed. Which is why the token count is the measurement and the dollar is arithmetic you can redo on your own card.
Answering vs gradingAnswering and grading are two separate bills
241 live calls were attempted for this kit's build and 240 returned something: 120 scored (r001), 120 stateless control (s001, of which 1 was cut off at the 4,000-token ceiling and returned nothing), and 1 live UI screenshot call outside either eval run. THE ONE THAT RETURNED NOTHING WAS BILLED IN FULL -- it ran to exactly 4,000 output tokens and was cut off, which is why discarded_usd is not zero (input tokens for that specific call were not separately logged; this figure uses the run's own average input length). The free floor and the wiring-proof stub made no call at all and cost $0.00.
Cost driversWhat actually moves the bill
PROVIDER-SIDE REASONING, LEFT AT THE DEFAULT. 75.2 pct of r001's output tokens (31,318 of 41,647) were reasoning that never reaches the parsed answer and still counts against the bill -- thinking was never sent on any published run, and whether disabling it holds accuracy is unmeasured (Eval.could_not_verify).
THE FIVE FIXED QUALITY/LINEAGE RULES, REPRINTED ON EVERY EXTRACT. About 473 of the 1,860 average input tokens per reading (roughly a quarter) is Rules DQ-1 through DQ-5, reproduced in full on every page so a forker can replace them without touching the prompt.
THE CADENCE, WHICH MULTIPLIES EVERYTHING. One call per open CDE per reporting period. A registry of 2,000 CDEs on this kit's quarterly cadence is 8,000 calls a year; the same registry monitored monthly is 24,000.
THE STEWARD NOTES, WHICH VARY IN LENGTH BUT NOT IN WHETHER THEY ARE SENT. Every reading pays for this section whether or not a root cause is actually being traced that period -- it cannot be selectively withheld without also hiding the one channel this kit has for an undocumented step.
Your volumeWhat it costs at your volume
LINEAR IN CDEs x REPORTING PERIODS, AND THAT IS THE WHOLE WARNING. Ten times the CDEs on the registry is ten times the calls at the same per-reading cost; nothing here amortises, because there is no index and each reading is independent of every other CDE's own history.
Where pricing changes shape
The output ceiling. MAX_TOKENS = 4,000 held on every one of the 120 scored (r001) readings, but 1 of 120 hit it exactly on the stateless control (s001) and returned nothing -- billed in full (4,000 output tokens) and counted as a failure. A ceiling set too low on a larger or differently-worded corpus is a lost reading on a paid run, not a saving.
Provider-side reasoning share. At 75.2 pct of output on the scored run, a model whose reasoning is not billed and one whose reasoning is billed differ by roughly 4x on the output line for the same answers.
Your return, with your numbers
Volumeopen CDEs per reporting period -- this run judged 120 (30 CDEs x 4 quarterly periods) per arm
What it replacesa data governance analyst working a CDE exception report each quarter: checking the measured rate against threshold, walking the lineage registry hop by hop, reading the steward's investigation notes, and remembering whether a finding for this incident has already been raised
Time saved per itemnot measured here -- it depends on how deep the lineage chain is and whether the steward has already written up an undocumented step, which is exactly the variable this kit measures rather than assumes
We publish the inputs, not a return: a return depends on your labour cost and your volume. The ROI dashboard takes it from here, and AI Costing explains the math.
Model choiceWhy this model
The same tier every other kit in this build lap is measured on, so the figures compare across use cases rather than across price lists -- see Eval.scores and the naming note above.
Other modelsOn other models
This is arithmetic, not a run. No model below was executed against the labelled set, and no accuracy is claimed for any of them. What transfers is the input volume: retrieval is model-independent, so every model would receive the same passages.
223,184input tokens · this run
41,647output tokens
—not priced — no committed card for the provider that ran it
The exact work behind every stateful number on these pages: 120 readings, one completion call each, one tier.
Model
Provider
One eval pass
This whole run
Per 1,000 queries
Rates as of
gpt-5-6-luna
OpenAI
$0.095
$0.095
$0.79
2026-09-12
gemini-3-flash
Google
$0.237
$0.237
$1.97
2026-09-18
gemini-3-8-flash
Google
$0.324
$0.324
$2.70
2026-09-18
claude-haiku-4-5
Anthropic
$0.431
$0.431
$3.60
2026-09-12
llama-5
Meta
$0.456
$0.456
$3.80
2026-09-18
grok-4-5
xAI
$0.696
$0.696
$5.80
2026-09-18
grok-4-6
xAI
$0.696
$0.696
$5.80
2026-09-18
claude-sonnet-5
Anthropic
$0.863
$0.863
$7.19
2026-09-12
gemini-3-1-pro
Google
$0.946
$0.946
$7.88
2026-09-18
gpt-5-6-terra
OpenAI
$0.946
$0.946
$7.88
2026-09-12
gpt-5-6-sol
OpenAI
$1.726
$1.726
$14.38
2026-09-12
claude-opus-4-8
Anthropic
$2.157
$2.157
$17.98
2026-09-12
claude-opus-5
Anthropic
$2.157
$2.157
$17.98
2026-09-12
claude-fable-5
Anthropic
$4.314
$4.314
$35.95
2026-09-18
claude-fable-5-1
Anthropic
$4.314
$4.314
$35.95
2026-09-18
gpt-6-astra
OpenAI
$4.314
$4.314
$35.95
2026-09-17
Read this against the numbers above
NOT MEASURED. Not one of these rows was run. They are this run's measured token counts multiplied by a published rate, and the rate is as of each row's own rates_as_of.
THE OUTPUT SIDE IS 75 PCT REASONING AND THAT IS WHAT MAKES THIS TABLE MOVE. A model that does not emit reasoning tokens, or does not bill them, would land nowhere near its row here for the same answers -- and one that reasons more would exceed it. Output is priced 3x to 6x input on every card, so this is most of the spread.
ACCURACY IS NOT PROJECTED. Every figure here is a price for the same token counts; nothing says another model would answer the same way, and on this task the free floor already ties the measured model on three of four graded columns.
THE STATELESS CONTROL IS NOT IN THIS TABLE. It is a separate run (s001-dq-lineage-stateless) with its own token counts, priced separately in Cost.cost_by_model.
PresenterOpens the private repo. Visible to admins only.
The codeEvery file, and what it is for
11 modules, no framework, and almost no dependencies. The pipeline is stdlib Python, because a kit is meant to be read and changed by someone who cloned it ten minutes ago — every dependency is a thing they have to understand before they can touch the part they came for.
Four of these are swap seams: the points you edit to make the kit yours. Each is marked, and each block below is the module’s real shape, read out of the file rather than written here.
The files on this page are not in the public GitHub catalog.
tools/build_corpus.pythe corpus generator — a swap seam
Generates 30 CDEs x 4 quarterly reporting periods = 120 extracts from a fixed seed (SEED = 20260824). The 7 undocumented-upstream CDEs are drawn from across three breach-pattern groups rather than concentrated in one, so the property is not separable by owning function or breach shape. The gold labels are src/dqstep.step's output over the planted breach plan, never typed.
You change it to: The 30 CDE definitions, their thresholds, their declared lineage chains and which are flagged undocumented-upstream. A forker points this at their own registry by keeping the eight section headings and supplying their own data/gold.jsonl.
tools/build_corpus.py
# Generate the corpus and the answer key. Deterministic: one seed, one corpus, forever.

HERE = os.path.dirname(os.path.dirname(os.path.abspath(__file__)))
CORPUS = os.path.join(HERE, "data", "corpus")
GOLD = os.path.join(HERE, "data", "gold.jsonl")
STATS = os.path.join(HERE, "data", "corpus-stats.json")
SEED = 20260824
RULE = "-" * 64
PERIOD_DATES = ["2025-03-31", "2025-06-30", "2025-09-30", "2025-12-31"]
PERIODS = len(PERIOD_DATES)
SEGMENTS = ["Retail Banking", "Commercial Banking", "Wealth Management",
src/dqstep.pythe quality/lineage arithmetic
The four-stage rule as pure code: breach-vs-threshold, the once-per-incident finding rule, and root-cause carry-forward while an incident stays open. No model, no judgement.
src/dqstep.py
# The critical-data-element (CDE) quality/lineage rule as arithmetic. Pure code, no model.

CLEAN = "CLEAN"
BREACH_NEW = "BREACH_NEW"
BREACH_ONGOING = "BREACH_ONGOING"
REMEDIATED = "REMEDIATED"
STAGES = (CLEAN, BREACH_NEW, BREACH_ONGOING, REMEDIATED)
YES = "YES"
NO = "NO"
RULE_TEXT = """\
def initial_state():
src/state.pythe carried state — a swap seam
SEAM -- the thing that makes this a monitor. Three scalars per CDE (incident_open, the root_cause_system last identified, the previous status), written from the arithmetic and never from the model's reply, rendered into one or two English sentences for the prompt.
You change it to: What is carried between reporting periods, and how it is worded to the model. Three scalars today, rendered as English rather than JSON -- a design choice, not a measurement.
src/state.py
# The carried state -- the thing that makes this a monitor and not a one-shot profiler.

def describe(state):
src/segment.pythe section splitter
Splits an extract into its eight named sections. Pure code; evals/check_labels.py asserts all eight are present in all 120 documents before a run may spend.
src/segment.py
# Split a CDE reporting-period extract into its named sections. Pure code, no model.

SECTIONS = ("Synthetic Record", "Critical Data Element", "Quality Rule",
RULE = "-" * 64
def split(text):
def render(secs):
src/select.pythe section selector
Decides which sections reach the model. Escalation Contact -- the data steward's name, mobile and email -- is mapped by no field and is subtracted unconditionally. Steward Notes ARE sent deliberately: they are the kit's only channel for an undocumented lineage step.
src/select.py
# Pick which sections of an extract are sent. Pure code -- the last deterministic step before

BANNER = "Synthetic Record"
CDE = "Critical Data Element"
RULE = "Quality Rule"
PROFILE = "Reporting Period Profile"
LINEAGE = "Lineage Registry"
POSITION = "Reporting Position"
NOTES = "Steward Notes"
CONTACT = "Escalation Contact"
NEVER_SENT = (CONTACT,)
src/prompt.pythe prompt
Three parts: the fixed instruction, the carried-state sentence, and the selected sections in document order. The stateless build replaces the sentence with a line saying no history is available.
src/prompt.py
# Assemble the one prompt this kit sends. No template engine, no framework -- string

INSTRUCTION = """\
def build(text, carried, stateless=False):
src/adapters/__init__.pythe model adapter — a swap seam
SEAM -- the model. Raw HTTP for every provider, standard library only, shared unmodified with every sibling kit in this repo.
You change it to: PROVIDER, BASE_URL, API_KEY and MODEL in .env. Adding a provider is one function and one entry in PROVIDERS; it must return token counts, because lens 05 publishes them and lens 07 prices them.
src/adapters/__init__.py
# SEAM 1 — the model. Swapping provider or model is .env plus the same run again.

class AdapterError(RuntimeError):
TRANSIENT = {408, 429, 500, 502, 503, 504}
RETRIES = 4
def _post(url, headers, payload, timeout=120):
def openai_compatible(cfg, system, user, max_tokens, thinking=None):
def anthropic(cfg, system, user, max_tokens):
PROVIDERS = {"openai-compatible": openai_compatible, "anthropic": anthropic}
THINKING_OFF = {"type": "disabled"}
def complete(cfg, system, user, max_tokens=1024, thinking=None):
src/watch.pythe watch
One CDE, one reporting period, one call. Parses the measured rate, threshold and structured profile fields off the page with a regex and parses NOTHING from the Lineage Registry or Steward Notes -- deciding the root cause from those is the entire task.
src/watch.py
# One CDE, one reporting period, one model call. The runtime half of the kit.

HERE = os.path.dirname(os.path.dirname(os.path.abspath(__file__)))
CORPUS = os.path.join(HERE, "data", "corpus")
SYSTEM = ("You are a scheduled data-quality and lineage watch for one bank's critical-data-element "
MAX_TOKENS = 4000
FIELDS = ("status", "affected_segment", "root_cause_system", "new_alert")
def documents():
def cdes():
def load_doc(doc_id):
def position_of(text):
src/app.pythe local UI
One CDE, one reporting period, its carried state and its verdict, on 127.0.0.1:8203. Shows the model's answer beside the free floor's, and an undocumented-step banner explaining what agreement or disagreement between the two columns means.
src/app.py
# The minimal local UI. Standard library only -- python3 -m src.app, then open the printed URL.

HERE = os.path.dirname(os.path.dirname(os.path.abspath(__file__)))
UI = os.path.join(HERE, "ui")
GOLD = os.path.join(HERE, "data", "gold.jsonl")
PORT = int(os.environ.get("PORT", "8203"))
RECORDED_RUN = os.environ.get("RECORDED_RUN", "r001-dq-lineage")
GOLD_ROWS = {r["doc_id"]: r for r in
def carried_for(doc_id):
class H(BaseHTTPRequestHandler):
def main():
evals/baseline.pythe free floor — a swap seam
Rule-based lineage matching against DECLARED, system-to-system metadata only -- $0.00, no model. Reads the Reporting Period Profile and Lineage Registry with regex, independently of src/dqstep.py, and NEVER reads Steward Notes.
You change it to: How aggressively the declared registry is read. This floor is the STRONGEST free reading of structured metadata alone; a forker with richer lineage tooling could raise this floor's ceiling on the documented cases.
Exact match on status, affected segment and new-finding alert; a normalised token-overlap match on the free-text root cause, split into three outcomes. Documents a real grading bug it caught on its own first pass before publishing.
evals/scoring.py
# Score a run against the answer key. Pure code, exact match on the categorical fields, a

STATUSES = ("CLEAN", "BREACH_NEW", "BREACH_ONGOING", "REMEDIATED")
UNDOCUMENTED_KEYWORDS = ("manual", "undocumented", "analyst", "spreadsheet", "workbook", "re-key",
def _norm(s):
def _norm_field(v):
def _contains_or_overlap(gold, ans, min_overlap=0.6):
def _mentions_undocumented(ans):
def grade_root_cause(gold_row, answer_text):
def _pct(n, d):
def score(records, golds):
Start hereThe shortest path into it
src/app.pyrun it and click around. It holds no pipeline logic on purpose; every number on screen comes from a module the eval harness already drives.
tools/build_corpus.pyGenerates 30 CDEs x 4 quarterly reporting periods = 120 extracts from a fixed seed (SEED = 20260824). The 7 undocumented-upstream CDEs are drawn from across three breach-pattern groups rather than concentrated in one, so the property is not separable by owning function or breach shape. The gold labels are src/dqstep.step's output over the planted breach plan, never typed. A swap seam.
src/dqstep.pyThe four-stage rule as pure code: breach-vs-threshold, the once-per-incident finding rule, and root-cause carry-forward while an incident stays open. No model, no judgement.
src/state.pySEAM -- the thing that makes this a monitor. Three scalars per CDE (incident_open, the root_cause_system last identified, the previous status), written from the arithmetic and never from the model's reply, rendered into one or two English sentences for the prompt. A swap seam.
src/segment.pySplits an extract into its eight named sections. Pure code; evals/check_labels.py asserts all eight are present in all 120 documents before a run may spend.
src/select.pyDecides which sections reach the model. Escalation Contact -- the data steward's name, mobile and email -- is mapped by no field and is subtracted unconditionally. Steward Notes ARE sent deliberately: they are the kit's only channel for an undocumented lineage step.
src/prompt.pyThree parts: the fixed instruction, the carried-state sentence, and the selected sections in document order. The stateless build replaces the sentence with a line saying no history is available.
src/adapters/__init__.pySEAM -- the model. Raw HTTP for every provider, standard library only, shared unmodified with every sibling kit in this repo. A swap seam.
src/watch.pyOne CDE, one reporting period, one call. Parses the measured rate, threshold and structured profile fields off the page with a regex and parses NOTHING from the Lineage Registry or Steward Notes -- deciding the root cause from those is the entire task.
evals/baseline.pyRule-based lineage matching against DECLARED, system-to-system metadata only -- $0.00, no model. Reads the Reporting Period Profile and Lineage Registry with regex, independently of src/dqstep.py, and NEVER reads Steward Notes. A swap seam.
evals/scoring.pyExact match on status, affected segment and new-finding alert; a normalised token-overlap match on the free-text root cause, split into three outcomes. Documents a real grading bug it caught on its own first pass before publishing.
Every entry above is a file in this kit, listed in the order the pipeline runs it.
PresenterOpens the private repo. Visible to admins only.
ScenariosWhat it costs at your volume
Everything below is computed from one measured base: 1859 input and 347 output tokens per reading (one CDE, at one reporting period), all of it fixed — this kit sends the document's own selected sections, so there is no retrieval depth to turn. Change the volume and the bill scales linearly, because nothing here batches.
Grading really is free here, and that is a property of the ruler rather than a discount
This kit is graded by pure code — the grader makes no model call, needs no key and sends nothing anywhere, so the grading line above is zero at every sampling rate and the leak count stays at nought. What that buys is a ruler you can run on every row, every time, for nothing. What it costs is reach: a code grader can only check what is mechanically checkable.
OperationsFour shapes of workload
The same arithmetic, at volumes worth naming. These are illustrations of scale, not measurements of anyone’s deployment.
Shape
Reading (one CDE, at one reporting period)s/day
Per day
Per month
Per year
Model follows the controls above.
What this ignoresWhere a real bill diverges
Read before quoting any of it
Output length is assumed constant.A terser or more verbose model moves it, and output is priced above input everywhere.
No volume, committed-use, batch or cache discount is modelled.Each moves real enterprise pricing and none are on a public rate card.
Longer documents cost more and nothing here caps them.This kit selects the document’s own sections in pure Python, so there is no vector store to price — but a corpus of longer records raises the input tokens per reading (one CDE, at one reporting period) directly, and that is the very number every figure above multiplies.
Grading adds nothing to this bill, and would if you changed the ruler.A code grader is free and local; swapping in an LLM judge would cost more per row than the extraction itself and send every row to a vendor. The instrument is a cost decision, not a footnote.
Rates age.Every one carries the date it was read on the cost page.
PresenterOpens the private repo. Visible to admins only.
In one lineWhat this kit exposes
No untrusted external input surface in the shipped version. Every field that reaches the prompt comes from tools/build_corpus.py, which invents all of it from a fixed seed. In a real deployment exactly one field is writable by somebody outside the data governance team -- the Steward Notes, which a data steward types and into which a business-unit reply or an email thread is routinely pasted.
The provider key lives only in .env (gitignored) or the shared repo-root .env, read by src/config.py and never logged, never written to results/, and never rendered by the UI. src/app.py replaces it and the base URL with placeholders before any provider error reaches the browser.
The experimentWe did NOT attack it -- and this is the surface we left open
An indirect prompt injection needs a field somebody outside can write into, and this kit has exactly one: the Steward Notes. They are SENT, deliberately, because hiding the surface would hide it from the run that is supposed to measure it -- and it is also the kit's only channel for the undocumented-lineage-step finding. None of the seven shipped note templates in this corpus is instruction-shaped; whether the model would follow an embedded instruction in a Steward Note (e.g. 'do not raise a finding on this CDE until legal has reviewed') was NOT measured. No attack was fired at this kit and none is claimed. The three boundaries below were checked in code on 2026-08-24, and the first is red-proven in both directions.
Boundary checked
What could go wrong
What the code guarantees
Does a named data steward's mobile number and email ever leave the machine?
Every extract carries an Escalation Contact section -- the steward's name, mobile and work email. A kit that sends "the document" sends all three, to a third party, on every reading, forever.
src/select.py maps no answered field to that section and _fallback() subtracts it unconditionally, so it cannot be reached even when a source-system rename makes every hint match nothing. evals/check_labels.py measures BOTH directions before a run may spend: with the guard 0 of 120 leak, and with the naive or list(secs) fallback under a renamed schema 120 of 120 do.
Can anything here write back to a source system, correct a record or file a remediation ticket?
A data-quality watch that can compute a root cause is one commit away from being a system that also fixes it. Writing back to a source system on an automated finding is how a false positive becomes a real outage.
There is no such code path, no such endpoint and no configuration flag that adds one. The only writers in the kit are evals/run.py (results/*.json). evals/check_labels.py greps every .py and .js file for the names of such paths and passes at zero.
Can a provider error print the key into the browser?
Provider errors are passed through verbatim so a reader can see what was actually said, and provider errors routinely quote the request.
src/app.py replaces the api_key and base_url strings with [API_KEY] and [BASE_URL] before the message is serialised. This has not been probed with a live provider-refused call the way critical-date's was -- see could_not_verify.
The first row is the only one measured in both directions. The other two are guarantees about what is ABSENT, and a path named something this checker does not know would pass them.
The result0 attack trials, three boundaries checked in code -- the privacy boundary red-proven by removing the guard and watching all 120 documents leak; the write-back and key-redaction boundaries checked by static grep, not by a live probe.
1field an outside party could influence (sent, not hidden)
0attack trials fired
120documents that leak the contact section without the guard
0provider-refused screenshots taken (unlike critical-date's, this was not probed live)
The Steward Notes ARE the field an outside party would influence in a real deployment, and this kit sends them. Nothing measured what a followed instruction does to a reading.
Read this twice
The Steward Notes reach the model verbatim, and this kit's own headline finding depends on the model reading them for a clue a structured registry cannot carry. That same channel is this kit's one injection surface. This kit produces a finding and cannot act, so the worst a followed instruction can do here is suppress or fabricate a row -- which in this vertical means a real data-quality incident goes unwatched.
HonestyWhat this does not prove
Whether a real deployment's Steward Notes -- prose a data steward writes freely, often pasting an email or a business-unit reply -- would carry an instruction the model follows. Not applicable to this synthetic corpus, and not measured.
WHETHER THE KEY REDACTION HOLDS AGAINST A PROVIDER THAT ECHOES A MASKED KEY. src/app.py's replacement is an exact-string match; critical-date's own equivalent guard was found incomplete this way by taking a live provider-refused screenshot. This kit's redaction path was not probed the same way -- it is the same code, unmodified, and untested here.
Whether the guardrail holds against a code path named something evals/check_labels.py does not know. It asserts the absence of names it knows.
Whether the withheld section stays withheld under a corpus that carries a NINTH section. The selector's guard is a subtraction and should, but nothing tests a shape this corpus cannot produce.
Whether the 30 CDE definitions, thresholds and lineage systems -- all invented -- would need different handling if a forker pointed this at a real registry. Almost certainly yes, and nothing here helps with it.
PresenterOpens the private repo. Visible to admins only.
In one lineThe guardrail is enforced in code
Not a prompt instruction the model can ignore — a comparison applied after the reply is parsed, before anything downstream sees it.
the guardrail, verbatim
No write-back, non-configurable. This kit produces a status, an affected segment, a root-cause system and a new-finding call. It never writes back to a source system, corrects a record, edits the lineage registry or files a remediation ticket, and there is no setting that makes it.
Everywhere and nowhere -- it is a property of what is ABSENT. The only writer in the kit is evals/run.py (results/*.json). There is no outbound path of any kind except the one completion call in src/adapters.
EvidenceDoes it hold?
What
Measured
Nothing in this kit writes back to a source system, corrects a record or files a ticket
0 code paths. evals/check_labels.py greps every .py and .js file in the kit for six such names and passes at zero, with the checker itself exempted because it is the only file that has to spell them.
The escalation contact section never reaches the provider
0 of 120 with the guard, 120 of 120 without it, both measured before any run spent.
The model's answer never becomes the next period's memory
src/state.py is written only by src/dqstep.step. evals/run.py advances the carried state from the answer key's inputs even on a reading that errored.
A run measured under a non-published token ceiling cannot be mistaken for a scored one
evals/run.py refuses --max-tokens unless the run id begins with c. No calibration run was fired for this kit; MAX_TOKENS = 4000 held on all 120 scored readings.
The limitWhat a guardrail is not
IT IS NOT A CHECK ON WHETHER THE ANSWER IS RIGHT. The arithmetic is correct whatever the model says, which means a wrong reading is a wrong finding and not a blocked action. The guardrail stops the kit acting; it does not stop it being wrong.
IT IS NOT A SCHEDULER. This is the half of a monitor the kit does not ship. evals/run.py is INVOKED, not woken, and nothing here detects a missed reporting period.
IT IS NOT A LINEAGE DISCOVERY TOOL. It reads a declared registry and a steward's own notes; it does not crawl pipelines, parse ETL code or infer lineage automatically. Where nobody has written the true origin down anywhere, this kit cannot find it -- see Business.not_good_enough.
WatchedWhat is watched, and why that one
4runs recorded
0 / 0deterministic metrics exact
+0.0%largest move — latency
0band breaches
—model half · needs provider URL
The kit measures 23 watched figures plus 8 comparability guards and 5 reference constants — three duties, not one list. 0 of the watched are grader rates, each on its own grader page; this board watches the ones that decide when to look again. Each square is one watched figure; filled means the latest run measured it.
17 measured by the latest run6 need the model half
Metric
Owner
Role
Why this one
field-exact-match
Status, affected segment and new-finding alert, per reading, exact match against the computed answer key
alarm
status_accuracy_pct; affected_segment_accuracy_pct; new_alert_accuracy_pct; missed_alerts; duplicate_alerts — alarm on duplicate_alerts above 0. A duplicate finding on an already-open incident is the alert-fatigue failure a governance team mutes after the second repeat -- the stateless control hits it 30 times out of 102 quiet periods.
root-cause-verdict
Root cause traced on BREACH_NEW findings, normalised text match against the answer key, split correct / one hop short / other miss
alarm
root_cause_correct_pct; documented_correct_pct; undocumented_correct_pct; undocumented_one_hop_short_pct — alarm on undocumented_one_hop_short_pct rising on the CLUED cells specifically (it is 0 pct there in this run) -- that would mean the model is failing to use evidence that exists in the file, a different and worse failure than not having evidence to use.
GuardsBefore any comparison
Preconditions, not alarms. If one moves, the runs were not measuring the same system and nothing else on this board may be differenced.
Guard
Value
If it moves
corpus.doc_count
120
different corpus — nothing is comparable
corpus.bytes
567,721
CDE profiles edited — the count held, the bytes did not
split.count
120
the CDE reporting-period extracts count moved — a different set was scored
split.size_p50
4,617
the median size of one CDE reporting-period extract moved
split.size_p95
5,015
the 95th-percentile size of one CDE reporting-period extract moved
dataset.rows
120
the test set changed — every rate has a new denominator
tokens.context_limit
1,000,000
different model family
index.build_seconds
0.3
no index is built here — a change is in corpus preparation, not an index rebuild
all shared guards held between the recorded runs (cadence quarterly, cdes 30, documented_cells 11, documents 120, new_alert_cells 18, quiet_cells 102, readings_scored 120, root_cause_cells 18, stateless False, undocumented_cells 7) — which is why the history below is allowed to mean anything.
The reference constants — the null-grader baseline, the adjudication matrix, the negative count — are the third duty. They are never re-measured per run: a baseline that moves with the thing it measures is not a baseline.
BandsThe alarm bands
Derived from evidence, never picked: exact-match where two runs reproduced a metric to the digit, wider than the measured same-input drift for latency, one row of the negative class for any rate — denominator printed beside it.
Group
Band
Denominator
Where the band comes from
status accuracy
not yet known
120 readings
A band is the spread between repeats and this kit fired one run per arm. What IS known is the spread between ARMS: the stateless control falls to 74.17 pct on the identical 120 readings.
root cause, undocumented origins
not yet known
7 findings
One run per arm, and this is the row's own headline column. 5 with a clue, 2 without -- a small denominator on both sides.
root cause, documented origins
not yet known
11 findings
One run per arm; the model and the free floor tie.
new-finding alert accuracy
not yet known
120 readings (18 raise cells, 102 quiet)
One run per arm. The stateless control's SAME 102 quiet cells produce 30 duplicate alerts -- the sharpest measured spread on this board.
coverage
not yet known
120 readings
100.00 pct on the scored run; the stateless control hit the 4,000-token ceiling once.
latency
not yet known
120 answered readings
One run per arm, on a shared provider account that nine kits were hitting at once, so the tail here is partly queueing and this kit cannot separate the two.
tokens
not yet known
120 readings
One run per arm. 75.2 pct of output is provider-side reasoning left at the default.
Affected segment accuracy
100.00 pct on r001-dq-lineage
120 readings
One run per arm, so no repeat spread exists yet; the figure is r001-dq-lineage's own, re-derived from its result file by build/measured/runlog.py.
Duplicate alert
0.00 pct on r001-dq-lineage
120 readings
One run per arm, so no repeat spread exists yet; the figure is r001-dq-lineage's own, re-derived from its result file by build/measured/runlog.py.
Missed alert
0.00 pct on r001-dq-lineage
120 readings
One run per arm, so no repeat spread exists yet; the figure is r001-dq-lineage's own, re-derived from its result file by build/measured/runlog.py.
Root cause correct
88.89 pct on r001-dq-lineage
120 readings
One run per arm, so no repeat spread exists yet; the figure is r001-dq-lineage's own, re-derived from its result file by build/measured/runlog.py.
Root cause one hop short
11.11 pct on r001-dq-lineage
120 readings
One run per arm, so no repeat spread exists yet; the figure is r001-dq-lineage's own, re-derived from its result file by build/measured/runlog.py.
Root cause other miss
0 on r001-dq-lineage
120 readings
One run per arm, so no repeat spread exists yet; the figure is r001-dq-lineage's own, re-derived from its result file by build/measured/runlog.py.
Undocumented one hop short
28.57 pct on r001-dq-lineage
120 readings
One run per arm, so no repeat spread exists yet; the figure is r001-dq-lineage's own, re-derived from its result file by build/measured/runlog.py.
Undocumented other miss
0 on r001-dq-lineage
120 readings
One run per arm, so no repeat spread exists yet; the figure is r001-dq-lineage's own, re-derived from its result file by build/measured/runlog.py.
HistoryRun history
4 recorded runs. A dash is a metric that run did not measure, and a dash is never differenced: not measured is a third state, neither a value nor a zero, and reading it as zero is how a board reports an improvement on a run that never looked. They are split into 3 blocks because a free floor is a baseline rather than a peer, and a run of another kind measures another thing; a column in one block is never differenced against a column in another.
triage · no model in the path — a baseline, not a peer column — 1 run. A floor is what the kit scores with no model in the path; it is the line the model runs have to beat, and it is never differenced against them.
Metric
b000-dq-lineage-floor 2026-08-24
affected segment accuracy, %
100.0
answered, %
100.0
documented correct, %
100.0
duplicate alert, %
0.0
input tokens, whole run
0
model latency p50 ms
0.00
model latency p95 ms
0.00
missed alert, %
0.0
new alert accuracy, %
100.0
output tokens, whole run
0
root cause correct, %
61.11
root cause one hop short, %
38.89
root cause other miss
0
status accuracy, %
100.0
undocumented correct, %
0.0
undocumented one hop short, %
100.0
undocumented other miss
0
one run A verdict is a comparison and one run has nothing to compare with, so the Verdict column is left off rather than filled with 17 chips that all say so.
triage · with the model in the path — 2 runs. Columns here are only ever compared with each other.
Metric
r001-dq-lineage 2026-08-24
s001-dq-lineage-stateless 2026-08-24
affected segment accuracy, %
100.00
99.17
answered, %
100.00
99.17
documented correct, %
100.0
100.0
duplicate alert, %
0.00
29.41
input tokens, whole run
223184
219542
model latency p50 ms
2382.00
2192.00
model latency p95 ms
6019.00
7226.00
missed alert, %
0.0
0.0
new alert accuracy, %
100.0
75.0
output tokens, whole run
41647
45495
root cause correct, %
88.89
88.89
root cause one hop short, %
11.11
11.11
root cause other miss
0
0
status accuracy, %
100.00
74.17
undocumented correct, %
71.43
71.43
undocumented one hop short, %
28.57
28.57
undocumented other miss
0
0
not a time series No two of these 2 runs measured the same system — they differ on documents, stateless — so nothing here may be differenced and the Verdict column is left off. Read this block DOWN a column, as a comparison between those runs, not along a row as a history.
stub · no model in the path — a baseline, not a peer column — 1 run. A floor is what the kit scores with no model in the path; it is the line the model runs have to beat, and it is never differenced against them.
Metric
t000-dq-lineage-stub 2026-08-24
affected segment accuracy, %
100.0
answered, %
100.0
documented correct, %
100.0
duplicate alert, %
29.41
input tokens, whole run
240432
model latency p50 ms
0.00
model latency p95 ms
0.00
missed alert, %
0.0
new alert accuracy, %
75.0
output tokens, whole run
6432
root cause correct, %
61.11
root cause one hop short, %
38.89
root cause other miss
0
status accuracy, %
67.5
undocumented correct, %
0.0
undocumented one hop short, %
100.0
undocumented other miss
0
one run A verdict is a comparison and one run has nothing to compare with, so the Verdict column is left off rather than filled with 17 chips that all say so.
DeviationsWhat deviated
0 breaches across 4 runs
The day a band breaks, a row renders here carrying the metric, the two runs, the band it crossed and what changed between them — model, prompt, chunker or top_k, read off the run records’ guards. A deviation with no diff beside it is an alarm nobody can act on.
RippleThe ripple map
Which figures move together, so one alarm reads as a system. Every edge carries its basis: measured names the run that showed it; reasoning admits nothing has varied it yet.
Lever
What moves
Basis
Evidence
whether the prompt carries the carried state
status 74.17 -> 100.00 pct, new-alert accuracy 75.00 -> 100.00, duplicate findings 30 -> 0 of 102 quiet periods
measured
r001-dq-lineage against s001-dq-lineage-stateless
whether the Steward Notes name the undocumented step
root cause on undocumented origins 0.00 -> 100.00 pct (0 of 2 without a clue, 5 of 5 with one)
measured
the 7 undocumented cells in r001-dq-lineage, split by clue_given
whether root cause is read from the declared registry alone or from the registry plus the notes
root cause on undocumented origins 0.00 -> 71.43 pct; root cause on documented origins unchanged at 100.00 pct both ways
measured
b000-dq-lineage-floor (registry only) against r001-dq-lineage (registry plus notes)
the published token ceiling
coverage 100.00 pct on r001 at 4,000; 99.17 pct on s001 at the identical ceiling
measured
r001-dq-lineage against s001-dq-lineage-stateless
FiresWhat fires when a band breaks
Where evals stop sitting beside the guardrail and start feeding it. Where the answer is nothing automatic, the row says so — hiding it would undo “What a guardrail is not” above.
Band
What fires
status accuracy
nothing yet. 100.00 pct, tying the $0.00 free floor exactly.
root cause, undocumented origins
nothing yet. 71.43 pct, against the free floor's 0.00.
root cause, documented origins
nothing yet. 100.00 pct, both arms.
new-finding alert accuracy
⚠︎ ADJACENT TO ONE THAT FIRED, IN THE CONTROL. 0 missed, 0 duplicate on the scored run; 0 missed, 30 duplicate on the stateless control.
coverage
⚠︎ THIS ONE ALREADY FIRED, IN THE CONTROL ONLY. 1 of 120 replies in s001 was cut off at the published ceiling; r001 hit no ceiling on any of its 120 readings.
latency
nothing yet. p95 is 2.5x p50.
tokens
nothing yet.
Affected segment accuracy
nothing yet — a second scored run is what would give this column a spread to fire on.
Duplicate alert
nothing yet — a second scored run is what would give this column a spread to fire on.
Missed alert
nothing yet — a second scored run is what would give this column a spread to fire on.
Root cause correct
nothing yet — a second scored run is what would give this column a spread to fire on.
Root cause one hop short
nothing yet — a second scored run is what would give this column a spread to fire on.
Root cause other miss
nothing yet — a second scored run is what would give this column a spread to fire on.
Undocumented one hop short
nothing yet — a second scored run is what would give this column a spread to fire on.
Undocumented other miss
nothing yet — a second scored run is what would give this column a spread to fire on.
NextThe three you would add first
A scheduler, and something that notices when a reporting period did not runThe kit has no cadence-risk analysis of its own (unlike critical-date's evals/cadence.py) -- whether skipping a quarter costs anything here is in Eval.could_not_verify, untested.
A second reader on any undocumented-origin finding with no clue in the notes2 of 7 undocumented findings in this run have no textual evidence anywhere in the file, and both the model and the free floor stop one hop short on both. A machine handing a human a queue only works if something reads that queue.
A structured field for 'undocumented step, confirmed absent' distinct from 'not yet investigated'This kit's could_not_verify names exactly this gap: there is no way to tell a CDE whose true origin is genuinely fully documented apart from one nobody has looked at yet.
Support for more than one concurrently open incident per CDEsrc/state.py carries ONE root_cause_system. A real registry with two simultaneous data-quality issues on the same CDE has nowhere for the second to be recorded.
None of these is built here. They are named against the seam they sit on so they can be argued with.
CadenceWhen to re-run, and what it costs
Re-run evals/check_labels.py (free, seconds) on any change to tools/build_corpus.py, src/dqstep.py, src/segment.py, src/select.py or src/prompt.py -- it is the gate that asserts the corpus still carries both a clued and an unclued undocumented case. Re-run the scored eval AND its stateless control together (paid, 240 calls) on any change to src/prompt.py or src/state.py, since the headline is a difference between the two.
What this cannot tell you
One run per arm. Whether the 0 missed / 0 duplicate alert record on r001 is stable across repeats is not measured.
Whether the guardrail holds against a code path named something the checker does not know.
Whether a followed instruction in the Steward Notes could suppress or fabricate a finding. The surface is sent and named; no attack was fired.
Whether an incident open longer than four consecutive reporting periods, or a CDE with two concurrent incidents, is handled sensibly. Neither is exercised by this corpus.
Whether the model's 5-of-5 clue-recognition rate generalises beyond this corpus's seven note templates.
PresenterOpens the private repo. Visible to admins only.
In one lineNo framework, deliberately
No framework and no dependencies at all -- json, os, re, random, http.server and concurrent.futures, all standard library. There is not even a date library, and the whole need is a fixed set of quarter-end strings compared with plain string equality, which is a judgement this kit states on the page rather than inheriting from somebody's default.
The mappingSeam by seam, who owns what
Seam
File here
Framework equivalent
Note
the carried state
src/state.py
agent memory layers and conversation stores (LangGraph checkpointers, LangChain memory, a vector store of prior runs)
those carry a TRANSCRIPT; this carries an INCIDENT -- three scalar fields written by arithmetic. You would gain persistence, concurrency and a query interface over history, and lose the thing that matters most on this task: a steward can be shown 'the root cause was settled at Collateral Management System, undocumented step' and check it against the actual investigation, and a checkpointed graph state cannot be checked against anything that specifically.
the model
src/adapters/__init__.py
LiteLLM, LangChain chat models, any provider-abstraction layer
you would gain dozens of providers, retries, streaming and callbacks. 200 lines of urllib is the whole abstraction here and it returns the token counts lens 05 publishes and lens 07 prices; a layer that normalises usage differently would make two kits' cost pages incomparable, and on this kit 75.2 pct of the output is reasoning tokens, which is exactly the field such layers most often drop.
the lineage reader
evals/baseline.py
a commercial data-lineage or data-catalog product (Collibra, Alation, OpenLineage-backed tooling)
you would gain automated, continuously-updated lineage discovery across real pipelines, which this floor does not attempt -- it reads a pre-declared, static registry. You would NOT automatically gain the one thing this kit measures: those tools also only ever know what was registered as a hop, so an undocumented manual step is invisible to them for the identical structural reason it is invisible to this floor.
the schedule
(not shipped)
cron, Airflow, Temporal, any durable scheduler
you would gain the half of a monitor this kit does not have -- reporting periods that actually happen on a clock -- and lose nothing this kit values. It is left out because the product here is a folder of readable Python and a scheduler would be the largest thing in the folder.
The seams are the ones this kit already publishes, so the mapping cannot drift from the code.
GraphsWhere LangGraph changes the answer
Nothing here is a graph, and the one place it looks like one is a straight line. Each CDE is a chain of four reporting periods and the only edge between them is three scalars. CDEs are independent of each other and run 30-wide.
The other sideWhat a framework costs you
No scheduler. This is a watch that carries state and is still INVOKED rather than woken, and this kit has no cadence-risk analysis of its own -- whether a missed reporting period costs anything is untested (Eval.could_not_verify).
No persistence layer beyond the run's own in-memory state, scoped to one eval run at a time (see src/state.py's module docstring pattern).
No lineage discovery. This kit assumes a registry already exists and is declared; building or maintaining that registry is entirely out of scope.
What we could NOT verify
No port to any framework was built, so every row above is reasoning about the seams rather than a measured alternative implementation.
Whether a commercial lineage tool's own investigation-note or annotation feature would recover the undocumented-step finding this kit measures. Untested; the structural argument (it can only know what is registered) is reasoning, not a run.
PresenterOpens the private repo. Visible to admins only.
In one lineWhat one run of this kit actually cost, in time and tokens
Measured on r001-dq-lineage on the same tier, memory removed (the control), 2026-08-24. This kit records telemetry measured per run — 4 of the 6 readings on this axis, 4 of them with a band the guardrail board can judge against.
The readingWhat the last run measured
Reading
Last run
Band
What fires
Model, median
2,382 ms
not yet known
nothing yet. p95 is 2.5x p50.
Model, p95
6,019 ms
not yet known
nothing yet. p95 is 2.5x p50.
Input tokens
223,184
not yet known
nothing yet.
Output tokens
41,647
not yet known
nothing yet.
No movement column. Not one of the 2 earlier runs on record is comparable with this one — a different model tier, or a changed guard — and differencing across that measures two systems rather than one. Said once here rather than as a dash on every row.
Retrieval not shown. No run of this kit has ever recorded a retrieval timing, because the pipeline has no such stage. Those readings are left out rather than dashed: a dash says “this run did not measure it”, which promises a later run could.
DriftMedian call, run over run
r001-dq-lineage2,382 ms
s001-dq-lineage-stateless2,192 ms
Hatched bars are runs that are not comparable with the latest — a different model tier or a changed guard. They are drawn because hiding them would make the history look shorter than it is, and greyed because differencing across them would be measuring two systems.
1 run not plotted. b000-dq-lineage-floor recorded no call latency at all — a rules-only floor run makes no model call, and the 0 its record stores is an absence, not a zero-millisecond answer. Plotting it would put a bar on this chart claiming the fastest run in the kit’s history.
The other sideWhat this does not tell you
What we could NOT verify
No stage-by-stage span tree. These are whole-call timings; which part of the pipeline spent the time is not recorded by this kit's harness.
Latency is a run-level median and p95. The spread between the fastest and slowest single call is not stored, so the distribution cannot be drawn.
No earlier run is comparable to this one (a different model tier or a changed guard), so nothing on this page is a trend yet.
One machine, one network, one region. Latency includes the provider round trip from a single location and will not transfer to yours.
The first of those is the one worth doing something about, and it is a solved problem: instrumenting a pipeline so each step reports its own duration is a couple of lines. Observability / tracing has the code, and what the result looks like once it is running.
PresenterOpens the private repo. Visible to admins only.
In one lineWhat you provision, honestly
Everything measured on this page says where it was measured; everything not measured says that — the same contract as the other thirteen pages. Where a retrieval index would be on other kits, this one has: no index — the population is re-read whole on each scheduled run, and the prior run's carried state is what makes a reading a CHANGE.
The machineWhat this needs
Dependencies
nothing beyond the standard library — requirements.txt names no package
Configuration
9 environment variables — the full knob table is at the bottom of this page
Last verified run
2026-08-24, across 4 committed records
Enumerated from the kit’s own source by build/facts/envscan.py, committed, and drift-checked — never typed into this page.
Your dataWhere everything sits
Artifact
Where
Leaves your machine?
CDE reporting-period extracts
data/corpus/CDE-<n>-P<k>.txt -- 120 files, 567721 bytes, generated once from a fixed seed by tools/build_corpus.py
seven of the eight sections go to the provider in the prompt; Escalation Contact -- the steward's name, mobile and email -- never does, by src/select.NEVER_SENT, and evals/check_labels.py measures both directions before a run may spend
the answer key
data/gold.jsonl -- one row per reading, computed, not typed
never. It is read by evals/scoring.py and src/app.py on your machine and no part of it is ever put in a prompt
the carried state
scoped to the eval run inside evals/run.py; a deployment would persist it as data/state.json per CDE
one or two SENTENCES of it do, in every prompt -- that is the experiment. They carry an open/closed flag, a root-cause label and a prior status name and nothing else; there is no transcript and no earlier extract in them
every run this kit has fired
results/eval-*.json
never. They are written locally and committed to the public kits repo on purpose, so a reader with no key can replay what the scored run answered
The wireWhat crosses it, and when
Runtime call site
Destination
src/adapters/__init__.py line 56
the configured BASE_URL
Build-time (corpus tooling, run once)
Destination
none — this kit’s corpus is generated locally
Zero-egress topology: point BASE_URL at a local OpenAI-compatible server and nothing leaves the machine — statically true of the shipped adapter, whose only credential travels in the Authorization header.
The third state
What the provider retains, trains on or logs once a request arrives is not measured here — it is provider-dependent, and this page does not assert what no run of ours can verify.
The shapeHow it ships, and what you add
The key
The provider key lives only in .env (gitignored) or the shared repo-root .env, read by src/config.py and never logged, never written to results/, and never rendered by the UI. src/app.py replaces it and the base URL with placeholders before any provider error reaches the browser.
You add
your reverse proxy and your identity in front of one process — the kit deliberately ships neither, because identity belongs to your estate, not to a kit
Never ships
Docker, Helm, a queue, a database. The product is a folder of readable Python; what to run it under is this page’s job to state, not the kit’s job to impose
The ladderEach decision, and what you provision past its ceiling
Decision
The kit ships
Measured here
Past the ceiling
What stops being valid
cadence
a QUARTERLY watch on the last calendar day of the quarter -- 2025-03-31, 06-30, 09-30, 12-31. One run owns exactly the period since the last one; root cause is traced fresh only on the period a breach first opens and carried forward, never re-derived, while it stays open (Rule DQ-3).
30 CDEs x 4 quarterly periods = 120 calls per arm, 0 gaps; evals/check_labels.py asserts all 30 sequences are complete before a run may spend. A registry of 2,000 CDEs on this cadence is 8,000 calls a year, roughly $16 on the shared projection card. (r001-dq-lineage, evals/check_labels.py, tools/build_corpus.py::PERIOD_DATES)
⚑ THIS KIT HAS NO CADENCE-RISK ANALYSIS OF ITS OWN, UNLIKE CRITICAL-DATE'S evals/cadence.py. Whether skipping a quarterly reporting period costs anything measurable here -- an incident that opens and closes entirely between two runs, for instance -- is untested and is in Eval.could_not_verify rather than measured.
every figure on this page is per a QUARTERLY watch over exactly four periods. An incident open longer than four consecutive periods, or a CDE re-breaching shortly after remediation within the same run, is untested -- Architecture.breaks_at_scale names both.
state
three scalars per CDE, written by src/dqstep.step and never from a model reply: whether an incident is currently open, the root_cause_system last identified, and the status last reported. Rendered into one or two English sentences for the prompt.
39 of the 120 readings are memory-dependent (BREACH_ONGOING or REMEDIATED). Removing the state moves status accuracy 100.00 -> 74.17 pct and duplicate findings 0 -> 30 of 102 quiet periods. (r001-dq-lineage against s001-dq-lineage-stateless; data/corpus-stats.json)
⚠︎ IT CARRIES ONE root_cause_system, NOT A LIST. A real registry with two concurrent open incidents on the same CDE has nowhere for the second to be recorded -- named in guardrails.add_first rather than shipped.
the state is scoped to the RUN inside evals/run.py, never to disk, because an eval that carried state between runs could not be re-run or compared with its own control. A real deployment's data/state.json would be one file per CDE, replaced atomically -- correct for one writer, not a concurrency model, and untested here.
model
one provider, one key, one completion per reading, MAX_TOKENS = 4000, thinking never sent. Swapping it is PROVIDER / BASE_URL / API_KEY / MODEL in .env and the same run again.
120 readings, 223184 input tokens and 41647 output on r001, of which 31318 (75.2 pct) was provider-side reasoning left at the default. p50 2382ms, p95 6019ms. 1 of 120 readings on the STATELESS CONTROL (s001) hit the 4000 ceiling and returned nothing; r001 hit no ceiling on any reading. (r001-dq-lineage, s001-dq-lineage-stateless)
⚠︎ NO CALIBRATION RUN WAS FIRED FOR THIS KIT, UNLIKE CRITICAL-DATE'S c000/c001. The 4000-token ceiling held on the scored run but was hit once on the stateless control -- whether it is safe on a longer or more heavily-reasoned corpus is unmeasured.
every cost figure here is a projection of THIS model's token counts onto a published card, and 75.2 pct of the output is reasoning. Nothing here measures whether another model would answer the same way.
labels
data/gold.jsonl -- one row per reading carrying the status, affected segment, root cause, new-alert call and carried-state input. Computed by tools/build_corpus.py from the planted breach plan, never hand-authored, and re-derived from src/dqstep.step by evals/check_labels.py before any run may spend.
120 rows, 0 mismatches on replay. The corpus carries 63 CLEAN, 18 BREACH_NEW, 30 BREACH_ONGOING and 9 REMEDIATED readings, and the 7 undocumented-origin findings split 5 clued / 2 unclued -- evals/check_labels.py asserts both splits are present in quantity rather than hoping for them. (data/gold.jsonl, data/corpus-stats.json, evals/check_labels.py)
⚠︎ ROOT CAUSE IS GRADED BY A KEYWORD-RECOGNITION TEST FOR THE UNDOCUMENTED CASES, NOT AN EXACT STRING. evals/scoring.py::UNDOCUMENTED_KEYWORDS was written by the same author who wrote the seven note templates it grades -- see Eval.could_not_verify for the vocabulary-overlap caveat this creates.
the labels are a property of a generator, so every accuracy on this page is measured against prose this author wrote. The undocumented-upstream rate (7 of 30, about 23 pct) is a corpus property, not a measured property of data governance in general -- see Data.bring_your_own_boundary.
Every threshold is a measurement with its provenance beside it, or says is_measured:false. A ceiling with no seam says so — it is the point the kit is outgrown, never a forced join.
When it failsFailure signatures
What you see
What it is
First move
a CDE reported BREACH_NEW on one period and CLEAN on the next, with no REMEDIATED period between them
the sample happened to fall back within threshold with no remediation recorded -- Rule DQ-4 says this is NOT evidence the issue was fixed, and the incident should still show as BREACH_ONGOING, not CLEAN. Check whether the prompt or the arithmetic dropped the carried incident_open flag.
replay the CDE's chain through src/dqstep.step by hand with remediation_recorded=False for that period and confirm it returns BREACH_ONGOING, not CLEAN (src/dqstep.py::step, Rule DQ-4)
a root cause named that is not in the declared Lineage Registry and does not appear anywhere in the Steward Notes either
a hallucination -- the model has invented a source with no evidence in the file. This kit's own measured behaviour on the two no-clue undocumented cells is to answer the SAME as the free floor (the first declared hop) rather than invent one; a reading that does otherwise has left the pattern this kit was built to demonstrate
check evals/scoring.py::grade_root_cause's outcome for that cell -- it will show 'other_miss', which occurred 0 times in the scored run r001 but is not structurally prevented (evals/scoring.py::grade_root_cause; r001-dq-lineage recorded 0 other_miss outcomes)
the same finding reported as new_alert YES on consecutive reporting periods for the same CDE
the carried state is not reaching the reading. incident_open is the only thing that distinguishes the period that first sees a breach from every period after it, and this is exactly what the stateless control does 30 times out of 102 quiet periods
compare against s001-dq-lineage-stateless's duplicate_alerts figure (30) and check whether the carried-state sentence is present in the assembled prompt (results/eval-s001-dq-lineage-stateless.json)
root cause on undocumented-origin findings dropping on the CLUED cells specifically
a different and worse failure than not having evidence to use -- the model is failing to read a clue that exists in the file, not merely lacking one. This did not happen in r001 (0 of 5 clued cells missed) but guardrails.bands names it as the alarm to watch
read the specific Steward Notes text for the missed cell and check whether evals/scoring.py::UNDOCUMENTED_KEYWORDS would recognise the model's phrasing -- a vocabulary mismatch is possible and is named in Eval.could_not_verify (evals/scoring.py::_mentions_undocumented; guardrails.bands, 'root cause, undocumented origins')
["Concurrency. A deployment's data/state.json would need to be one file per CDE, replaced atomically -- correct for one writer, and untested here.", 'A missed reporting period. Nothing here detects one, back-fills it, or marks the readings it produced as late, and this kit has no cadence-risk analysis of its own.', 'A CDE registry that changes between periods -- a CDE added, retired, or its declared lineage amended mid-run. All 30 CDEs here are live and unchanged across all 4 periods.', "Whether disabling provider-side reasoning holds the accuracy. 75.2 pct of r001's output was reasoning and thinking was never sent.", 'Repeats. One run per arm, so no band on any figure.', 'Whether English or structured JSON is the better rendering of the carried state. A design choice, not a measurement.', "Real steward prose. Every note here is one of seven templates the author wrote, which is part of why the model's undocumented-case recognition (5 of 5 with a clue) may not transfer.", 'An incident open longer than four consecutive reporting periods, or two incidents open on one CDE at once. Neither is exercised by this corpus.']
The corpus licence, from the Data lens: MIT, same as the rest of adhana-ai/adhana-foundry-kits Your corpus’s licence is yours to verify, and the labels you write are about your documents.
Status, affected segment and new-finding alert, per reading, exact match against the computed answer key
Trace a bank's bad data back to its source
PresenterOpens the private repo. Visible to admins only.
In one lineStatus, affected segment and new-finding alert, per reading, exact match against the computed answer key
For each of the 120 readings, did the reply's status, affected_segment and new_alert equal the computed answer key? All three are words from a closed list (or 'none'/'n/a'), compared exactly.
$0.00per 1,000 CDE profiles
nodata leaves your network
yessame answer every time
MethodHow the test was run
evals/scoring.py::score, in-process, no key and no model. The same function scores the model, the stateless control and the free floor.
Every grader on these pages scored the same 120 already-recorded answers. Nothing was re-generated, so this compares rulers and not models.
The inputOne real row, seen by every grader
The reading
CDE-0014-P2, GL Account Reconciliation Flag -- reporting period P2 of 4, 2025-06-30. Measured failing rate 1.18 pct against a 0.45 pct threshold; no incident was open before this period.
The declared, system-to-system Lineage Registry
Four declared hops, all showing 76 exceptions (the full failing count): Collateral Management System -> Enterprise Data Lake Staging -> Enterprise Data Warehouse -> Basel Capital Engine. Earliest nonzero hop: Collateral Management System.
The Steward Notes
"Investigation note: the exceptions were traced back further than the registered pipeline. A third-party vendor file is manually reconciled and pasted into Collateral Management System by an operations analyst each reporting period, and that is where the mismatch originates -- this step is not currently registered in the lineage tool."
The answer key
status BREACH_NEW, affected_segment Commercial Banking, root_cause_system the undocumented manual vendor-file reconciliation (pre-Hop 1), new_alert YES
The model said
status BREACH_NEW, affected_segment Commercial Banking, root_cause_system "Manual reconciliation of third-party vendor file (undocumented analyst step before Hop 1 into Collateral Management System)", new_alert YES
It is the shape this whole kit is built to measure. The Lineage Registry shows every declared hop exceptioned, which points at the first one -- Collateral Management System -- and that is a DEFENSIBLE answer from the table alone; it is also the free floor's answer, and one hop short of the truth. The Steward Notes carry the clue in plain prose. The model reads it and correctly names the undocumented step; the free floor structurally cannot, because it never reads that section. Three of four fields tie across all three arms -- this is the one that does not.
Grader
Verdict
Why
Status, affected segment and new-finding alert, per reading, exact match against the computed answer key
all three fields hit, all three arms agree
the tie itself is the finding: nothing here separates the model from the $0.00 floor
Root cause traced on BREACH_NEW findings, normalised text match against the answer key, split correct / one hop short / other miss
model: correct. free floor: one hop short.
the free floor's answer is not wrong given what it can see -- it is the row's own open item, made concrete on one real reading
The formulaWhat it computes
accuracy = hits / 120 per field. A reading whose reply did not parse counts as a MISS in every field, never as an exclusion -- coverage is published beside every accuracy (answered_pct).
The analysisWhat it actually did
Model
Result
the fast tier, with the carried state
100.0% status accuracy · 2 more measured on this row
the same tier, memory removed (the control)
74.2% status accuracy · 2 more measured on this row
the free floor, declared-registry lineage only
100.0% status accuracy · 2 more measured on this row
In operationWhat to monitor
Reference standard: data/gold.jsonl, computed by tools/build_corpus.py over the planted breach plan at generation time and re-derived from src/dqstep.step by evals/check_labels.py before any run may spend. This grader IS the reference, so its own TPR/TNR are not measured -- scoring it against itself would be circular.
These rates are UNKNOWN, on purpose
This grader's own error rate is not measured and cannot be: it IS the reference. What can be wrong is the KEY, and the arithmetic that produced it (src/dqstep.py) is re-derived and cross-checked by evals/check_labels.py before any paid run.
Watch these
status_accuracy_pct
affected_segment_accuracy_pct
new_alert_accuracy_pct
missed_alerts
duplicate_alerts
Alarm on
duplicate_alerts above 0. A duplicate finding on an already-open incident is the alert-fatigue failure a governance team mutes after the second repeat -- the stateless control hits it 30 times out of 102 quiet periods.
How tight can the band be? No tuned threshold anywhere on the model path -- the reply decides. new_alert has a denominator of 18 (readings where a NEW finding is due) against 102 quiet periods, so one row moves missed/duplicate rates by 5.6 or 1.0 points respectively.
Cadence: Re-run evals/check_labels.py (free) on any change to tools/build_corpus.py, src/dqstep.py, src/segment.py, src/select.py or src/prompt.py. Re-run the scored eval AND its stateless control together (paid, 240 calls) on any change to src/prompt.py or src/state.py.
The decisionWhen to reach for it
Use it
The truth is known and all three fields are words from a closed list.
Do not use it
The truth is not known -- the normal state of a real CDE registry, where whether a finding is genuinely new or a continuation is a judgement call a steward makes by reading the history. That is why this corpus is generated rather than captured.
Root cause traced on BREACH_NEW findings, normalised text match against the answer key, split correct / one hop short / other miss
Trace a bank's bad data back to its source
PresenterOpens the private repo. Visible to admins only.
In one lineRoot cause traced on BREACH_NEW findings, normalised text match against the answer key, split correct / one hop short / other miss
For each of the 18 BREACH_NEW findings, does the free-text root_cause_system answer name the TRUE root cause? Scored in three outcomes rather than a binary: 'correct' (names the true system or recognises the undocumented step in its own words), 'one hop short' (names exactly the first declared hop when the true origin sits before it), 'other miss' (anything else).
$0.00per 1,000 CDE profiles
nodata leaves your network
yessame answer every time
MethodHow the test was run
evals/scoring.py::grade_root_cause, in-process, no key and no model. The same function scores all three arms.
Every grader on these pages scored the same 120 already-recorded answers. Nothing was re-generated, so this compares rulers and not models.
The inputOne real row, seen by every grader
The reading
CDE-0014-P2, GL Account Reconciliation Flag -- reporting period P2 of 4, 2025-06-30. Measured failing rate 1.18 pct against a 0.45 pct threshold; no incident was open before this period.
The declared, system-to-system Lineage Registry
Four declared hops, all showing 76 exceptions (the full failing count): Collateral Management System -> Enterprise Data Lake Staging -> Enterprise Data Warehouse -> Basel Capital Engine. Earliest nonzero hop: Collateral Management System.
The Steward Notes
"Investigation note: the exceptions were traced back further than the registered pipeline. A third-party vendor file is manually reconciled and pasted into Collateral Management System by an operations analyst each reporting period, and that is where the mismatch originates -- this step is not currently registered in the lineage tool."
The answer key
status BREACH_NEW, affected_segment Commercial Banking, root_cause_system the undocumented manual vendor-file reconciliation (pre-Hop 1), new_alert YES
The model said
status BREACH_NEW, affected_segment Commercial Banking, root_cause_system "Manual reconciliation of third-party vendor file (undocumented analyst step before Hop 1 into Collateral Management System)", new_alert YES
It is the shape this whole kit is built to measure. The Lineage Registry shows every declared hop exceptioned, which points at the first one -- Collateral Management System -- and that is a DEFENSIBLE answer from the table alone; it is also the free floor's answer, and one hop short of the truth. The Steward Notes carry the clue in plain prose. The model reads it and correctly names the undocumented step; the free floor structurally cannot, because it never reads that section. Three of four fields tie across all three arms -- this is the one that does not.
Grader
Verdict
Why
Status, affected segment and new-finding alert, per reading, exact match against the computed answer key
all three fields hit, all three arms agree
the tie itself is the finding: nothing here separates the model from the $0.00 floor
Root cause traced on BREACH_NEW findings, normalised text match against the answer key, split correct / one hop short / other miss
model: correct. free floor: one hop short.
the free floor's answer is not wrong given what it can see -- it is the row's own open item, made concrete on one real reading
The formulaWhat it computes
A normalised token-overlap/containment match against the gold system name for the 11 documented-origin findings; a keyword recognition test (evals/scoring.py::_mentions_undocumented) against the 7 undocumented-origin findings, because the undocumented step has no fixed proper name to match exactly.
The analysisWhat it actually did
Model
Result
the fast tier, with the carried state
88.9% root cause correct · 3 more measured on this row
the same tier, memory removed (the control)
88.9% root cause correct · 3 more measured on this row
the free floor, declared-registry lineage only
61.1% root cause correct · 3 more measured on this row
In operationWhat to monitor
Reference standard: The same data/gold.jsonl, carrying the TRUE root_cause_system planted by the generator (a declared hop for 11 findings, an invented undocumented-step label for 7) and, for the 7, the first declared hop's name as the specific 'one hop short' answer.
These rates are UNKNOWN, on purpose
Whether the keyword list evals/scoring.py::UNDOCUMENTED_KEYWORDS matching 'recognises the gap' is itself a good proxy for correctness on a real steward's prose -- this corpus's seven note templates were written by the same author who wrote the keyword list, so the 5-of-5 clued result may partly reflect vocabulary overlap rather than pure reasoning. Untested against a real, independently-written note.
Watch these
root_cause_correct_pct
documented_correct_pct
undocumented_correct_pct
undocumented_one_hop_short_pct
Alarm on
undocumented_one_hop_short_pct rising on the CLUED cells specifically (it is 0 pct there in this run) -- that would mean the model is failing to use evidence that exists in the file, a different and worse failure than not having evidence to use.
How tight can the band be? Small denominators throughout: 7 undocumented cells split 5 clued / 2 unclued. One cell moving changes the undocumented rate by 14.3 points -- read the count, not just the percentage.
Cadence: Re-run with the scored eval. Re-run evals/check_labels.py's 'both a clued and an unclued arm' assertion on any change to tools/build_corpus.py's CLUE_IDX / UNDOCUMENTED_IDX.
The decisionWhen to reach for it
Use it
A finding is newly raised (status == BREACH_NEW) and a root cause is actually asked for.
Do not use it
status is CLEAN, BREACH_ONGOING or REMEDIATED -- root cause is carried forward or not applicable, and is not independently re-graded on those cells in this run.
A living map of modern AI — kept current every morning